. 2013 Mar;109(3):375-90.
doi: 10.1160/TH12-10-0721. Epub 2013 Feb 14.

Non-invasive imaging for studying anti-angiogenic therapy effects

Affiliations

Non-invasive imaging for studying anti-angiogenic therapy effects

Josef Ehling et al. Thromb Haemost. 2013 Mar.

Abstract

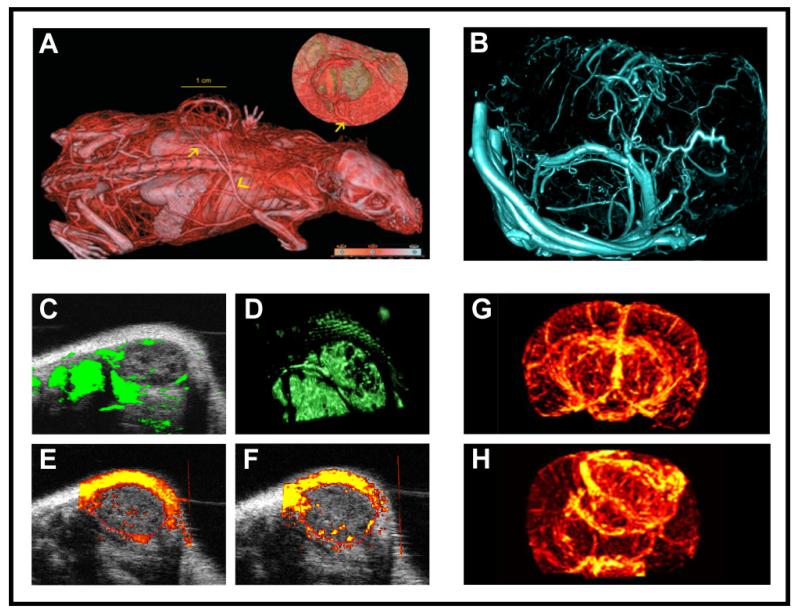
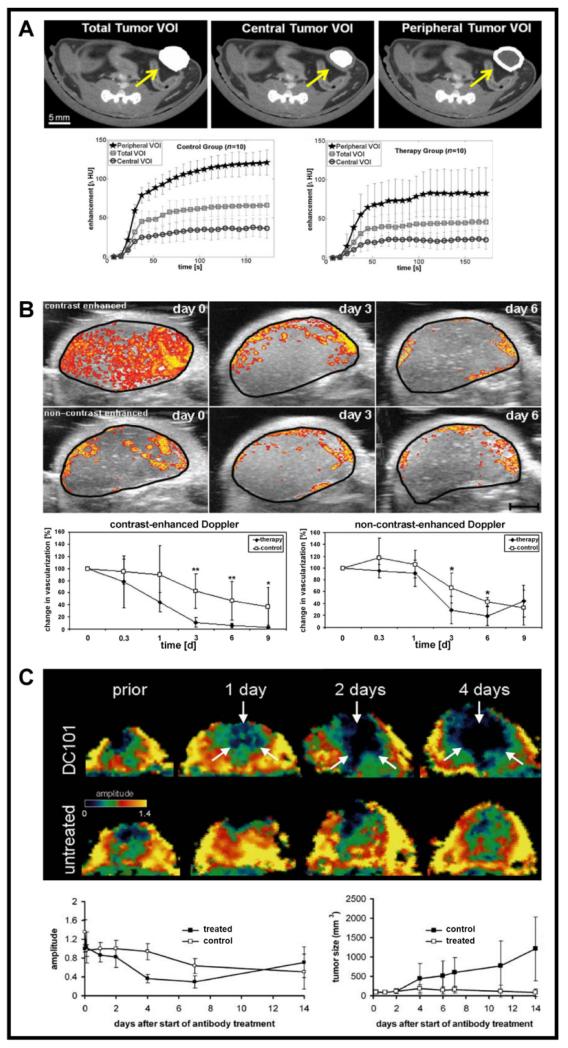
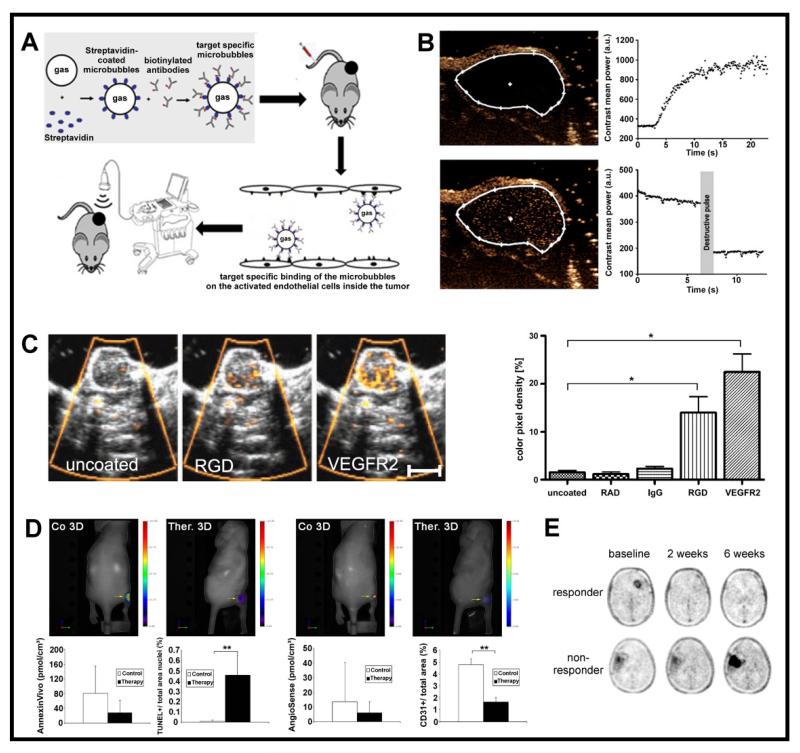
Noninvasive imaging plays an emerging role in preclinical and clinical cancer research and has high potential to improve clinical translation of new drugs. This article summarises and discusses tools and methods to image tumour angiogenesis and monitor anti-angiogenic therapy effects. In this context, micro-computed tomography (µCT) is recommended to visualise and quantify the micro-architecture of functional tumour vessels. Contrast-enhanced ultrasound (US) and magnetic resonance imaging (MRI) are favourable tools to assess functional vascular parameters, such as perfusion and relative blood volume. These functional parameters have been shown to indicate anti-angiogenic therapy response at an early stage, before changes in tumour size appear. For tumour characterisation, the imaging of the molecular characteristics of tumour blood vessels, such as receptor expression, might have an even higher diagnostic potential and has been shown to be highly suitable for therapy monitoring as well. In this context, US using targeted microbubbles is currently evaluated in clinical trials as an important tool for the molecular characterisation of the angiogenic endothelium. Other modalities, being preferably used for molecular imaging of vessels and their surrounding stroma, are photoacoustic imaging (PAI), near-infrared fluorescence optical imaging (OI), MRI, positron emission tomography (PET) and single photon emission computed tomography (SPECT). The latter two are particularly useful if very high sensitivity is needed, and/or if the molecular target is difficult to access. Carefully considering the pros and cons of different imaging modalities in a multimodal imaging setup enables a comprehensive longitudinal assessment of the (micro)morphology, function and molecular regulation of tumour vessels.


Figures

Figure 1
Figure 1. Micro-morphological imaging of tumor angiogenesis
A: In vivo visualization of tumor blood vessels in a subcutaneously implanted HaCaTras-A-5RT3 squamous cell carcinoma xenograft using contrast-enhanced μCT in combination with an iodine-based contrast agent [19]. B: For a highly resolved 3D visualization of the micromorphology of tumor blood vessels, tumor-bearing mice can be perfused with Microfil®, a lead-containing CT contrast agent which polymerizes intravascularly. After perfusion, excised tumors are scanned using an ultra-high resolution μCT scanner resulting in a resolution of less than 10 μm voxel side length. C-F: For rapid morphological imaging of blood microvessels in subcutaneous tumors, 3D contrast-enhanced US before (C) and after volume rendering (D), Power Doppler US (E) and contrast-enhanced Power Doppler US (F) can be used. G-H: Finally, MR angiography techniques using Blood Oxygen Level Dependent (BOLD) imaging enable the visualization of the 3D vascular network of tumors. After inducing hypoxia via the inhalation of 8% oxygen, BOLD contrast generates high-resolution maps of normal brain (G) and tumor brain vasculature (H) using a 9.4 Tesla scanner. For investigating micro-morphological aspects, maximum intensity projection (MIP) images can be obtained, which clearly show differences in symmetry and density of blood vessels in brain tumors vs. healthy brain tissue (reproduced with permission from [47]).
Figure 2
Figure 2. Functional imaging of tumor angiogenesis
A: Dynamic μCT imaging is highly suitable for assessing anti-angiogenic therapy effects. During the CT scan, a blood pool contrast agent is injected intravenously. After tumor segmentation and determination of different volumes of interest (VOI) within the tumor (e.g. total tumor volume vs. tumor center vs. tumor periphery), dynamic contrast-enhanced μCT imaging can be employed to longitudinally quantify differences between treated and non-treated animals (reproduced from [20] with kind permission from Springer Science + Business Media). B: Another method for non-invasively assessing anti-angiogenic therapy effects, especially those depending on the maturity of tumor blood vessels, relies on the combination of contrast-enhanced and non-contrast-enhanced high-frequency volumetric Power Doppler US. Because contrast-sensitive US is more sensitive for small immature vessels (primarily in the tumor center in this particular example), whereas flow-sensitive non-contrast-enhanced US mostly captures large and mature vessels (primarily in the tumor periphery), the combination of both methods can provide non-invasive feedback on blood vessel maturation in tumors during anti-angiogenic treatment. As early as 3 days after the beginning of anti-angiogenic treatment with sunitinib in mice with subcutaneously inoculated A431 tumors, a regression of immature vessels in the tumor center can be observed, while large and mature vessels at the tumor periphery are only partially affected (data from [64]). C: A third modality which is highly suitable for visualizing and quantifying anti-angiogenic therapy effects is DCE-MRI. Upon treating mice bearing subcutaneous squamous cell carcinoma xenografts, anti-angiogenic therapy with the VEGFR-2-blocking antibody DC 101, representative parameter maps of the amplitude A were acquired over a 4 day period. Changes in the amplitude, assessed using the Brix model, are shown in the lower left panel, and were compared with changes in tumor volume (lower right panel). This comparison clearly shows that therapy effects can be observed much earlier when monitoring changes in the amplitude. At later time points, when treated tumors had decreased in volume while non-treated tumors had increased, amplitude levels re-increased in treated tumors, and were even higher than in non-treated tumors. This can be explained by the fact that resorption of central tumor parts had occurred upon anti-angiogenic therapy, and that large and mature vessels from the tumor periphery had drawn closer together (reproduced from [36], with permission from Neoplasia).
Figure 3
Figure 3. Molecular imaging of tumor angiogenesis
A: Schematic setup of molecular US imaging in subcutaneous mouse tumors using antibody-functionalized microbubbles (MB), which specifically bind to angiogenesis-associated markers, such as VEGFR-2 or αvβ3 integrins. B: Example for the in vivo quantification of VEGFR-2-targeted MB binding to angiogenic blood vessels in subcutaneous CT26 tumors. Before MB injection, hardly any signal is detected in tumors (upper left panel). Contrast agent injection leads to an increase of signal intensity due to inflowing MB, confirming efficient tumor perfusion (upper right panel). After waiting for seven minutes, a significant amount of VEGFR2-targeted MB can be observed within the tumor (lower left panel). Upon reaching a plateau phase (of 400 a.u. in this example), a high-mechanical index destructive US pulse is applied, which destroys all MB (lower right panel). The difference in signal intensity before and after application of this destructive US pulse correlates with the amount of bound MB, and therefore with the expression levels of VEGFR-2 (A and B reprinted from [100] with permission from Elsevier). C: Using SPAQ technique, the expression levels of VEGFR-2 or αvβ3 were assessed in squamous cell carcinoma xenografts (HaCaT-ras-A-5RT3) in mice. Hardly any accumulation of uncoated, RAD- and IgG-targeted control MB was observed using Power Doppler US; RGD- or VEGFR-2-targeted MB, on the other hand, showed prominent binding to tumor blood vessels (data from [68]). D: Fluorescense-based molecular imaging of apoptosis and angiogenesis using FMT. In sunitinib-treated vs. non-treated A431 tumor-bearing mice, apoptosis was non-invasively investigated using Annexin Vivo 750, a near-infrared fluorescence probe that selectively binds to cell membranes during the early stages of apoptosis. Tumor vascularization was investigated using AngioSense 680, a blood pool marker. While vascularization significantly decreased in treated tumors, no enhanced annexin accumulation was observed although the gold standard TUNEL staining indicated an increased apoptosis rate (data form [76]). E: Representative examples of longitudinal malignant glioma monitoring using 18F-FLT PET in patients treated with bevacizumab. The FLT-uptake at baseline was determined before treatment. At later time points, 18F-FLT PET imaging can be used to discriminate responders from non-responders and 18F-FLT tumor uptake changes at 2 and 6 weeks were significant predictors of progression-free survival by Kaplan-Meier analysis (P < 0.001) (reprinted by permission of the Society of Nuclear Medicine from [96], figure 1).

Similar articles

Cited by

References

    1. Folkman J. Angiogenesis in cancer, vascular, rheumatoid and other disease. Nat Med. 1995;1:27–31. - PubMed
    1. Carmeliet P, Jain RK. Molecular mechanisms and clinical applications of angiogenesis. Nature. 2011;473:298–307. - PMC - PubMed
    1. Hanahan D, Weinberg RA. Hallmarks of cancer: the next generation. Cell. 2011;144:646–74. - PubMed
    1. Bergers G, Benjamin LE. Tumorigenesis and the angiogenic switch. Nat Rev Cancer. 2003;3:401–10. - PubMed
    1. Ferrara N. VEGF and the quest for tumour angiogenesis factors. Nat Rev Cancer. 2002;2:795–803. - PubMed

Publication types

MeSH terms