

Optimization of the Expression of Genes Encoding Poly (3-hydroxyalkanoate) Synthase from Pseudomonas aeruginosa PTCC 1310 in Escherichia coli
- PMID: 23407789
- PMCID: PMC3558199
Optimization of the Expression of Genes Encoding Poly (3-hydroxyalkanoate) Synthase from Pseudomonas aeruginosa PTCC 1310 in Escherichia coli
Abstract
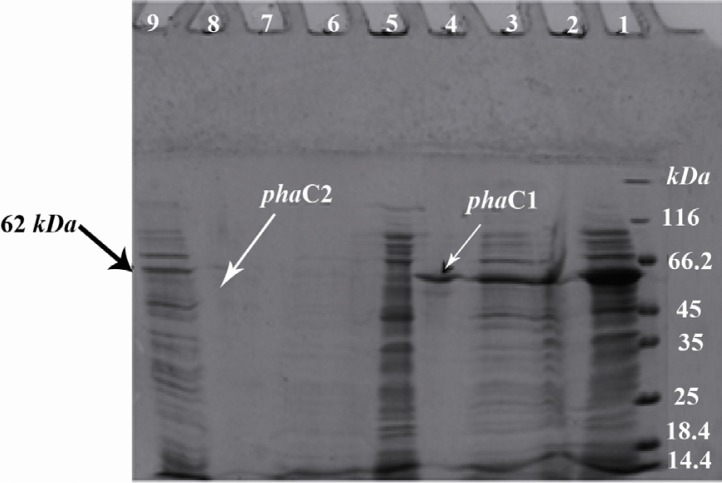
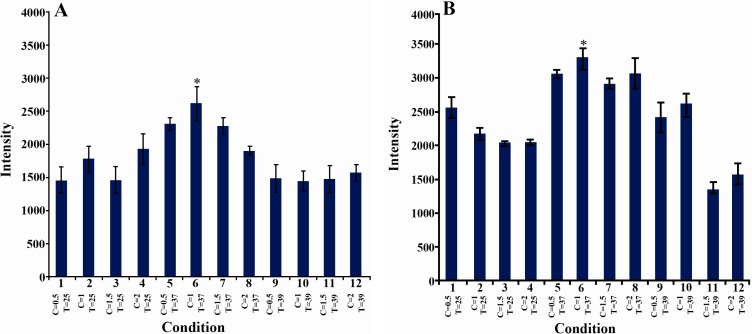
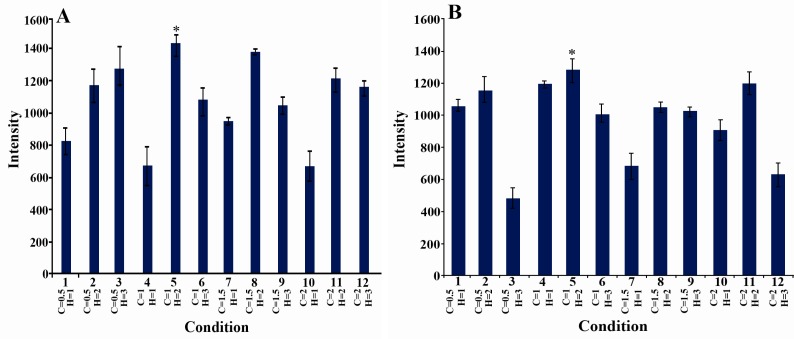
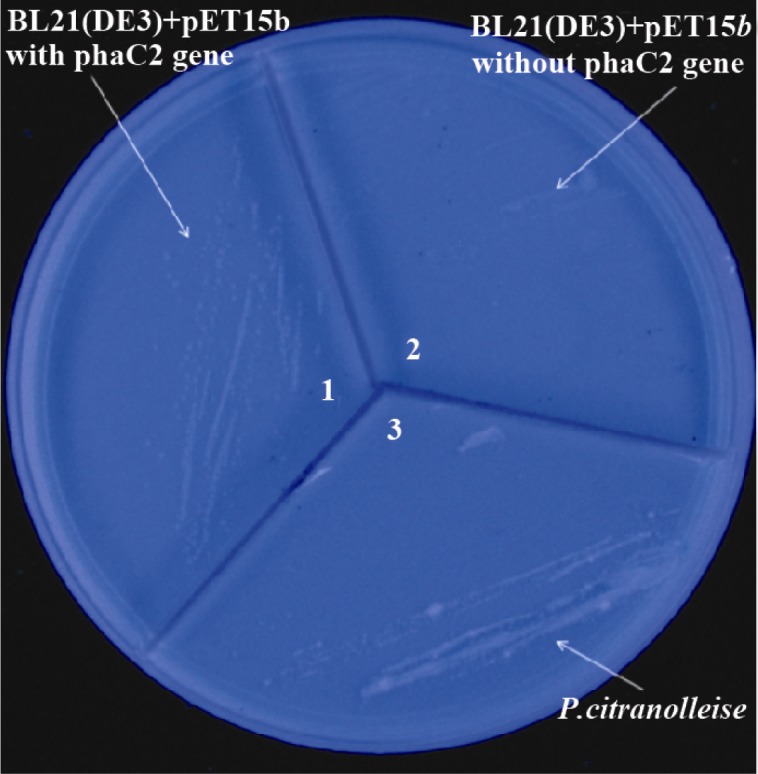
Over the years, the use of plastics has complicated the problem of disposal of solid wastes. One strategy to reduce plastic waste is the use of biodegradable plastics. A group of these plastics are polyhydroxyalkanoates (PHAs). To date more than 250 different microorganisms are known to synthesize and accumulate PHA. Most Pseudomonas strains are able to accumulate mcl-PHA. In previous studies, the phaC1 and phaC2 genes were identified in Pseudomonas aeruginosa (P.aeruginosa) PTCC 1310 and were cloned. The aim of this study was to express these genes and optimize the conditions for their expression. The inserts obtained from vectors pTZPHAC1 and pTZPHAC2 were subcloned into pET15b expression vector. After transformation of competent Escherichia coli (E.coli) BL21 (DE3) cells with recombinant plasmids, expression was induced using IPTG. By changing expression conditions such as IPTG concentration, time and temperature of incubation with IPTG, the expression conditions for these enzymes were optimized, and the obtained results were compared using proper statistical analysis. The PHA synthase genes were induced with IPTG and the expressed 62 kDa protein was observed and purified. By changing expression conditions, 1 mM IPTG, 37 °C and a 2 hr incubation provided the highest level of protein production in E.coli cells. These results suggest that induction condition of PhaC genes can influence expression of PHA synthase enzymes.
Keywords: PhaC1; PhaC2; Polyhydroxyalkanoate; Protein expression.
Figures
References
-
- Verlinden RAJ, Hill DJ, Kenward M, Williams CD, Radecka I. Bacterial synthesis of biodegradable polyhydroxyalkanoates. J Appl Microbiol. 2007;102(6):1437–1449. - PubMed
-
- Rehm BH, Steinbüchel A. Polyhydroxyalkanoate (PHA) synthases: the key enzymes of PHA synthesis. Biopolymers Online. 2002;3:173–215.
-
- Rehm BH, Steinbuchel A. Biochemical and genetic analysis of PHA synthases and other proteins required for PHA synthesis. Int J Biol Macromol. 1999;25(1-3):3–19. - PubMed
-
- Philip S, Keshavarz T, Roy I. Polyhydroxyalkanoates: biodegradable polymers with a range of applications. J Chem Technol Biotechnol. 2007;82(3):233–247.
-
- Terpe K. Overview of bacterial expression systems for heterologous protein production: from molecular and biochemical fundamentals to commercial systems. Appl Microbiol Biotechnol. 2006;72(2):211–222. - PubMed
LinkOut - more resources
Full Text Sources