

Combined diffusion-weighted and functional magnetic resonance imaging reveals a temporal-occipital network involved in auditory-visual object processing
- PMID: 23407860
- PMCID: PMC3570774
- DOI: 10.3389/fnint.2013.00005
Combined diffusion-weighted and functional magnetic resonance imaging reveals a temporal-occipital network involved in auditory-visual object processing
Abstract
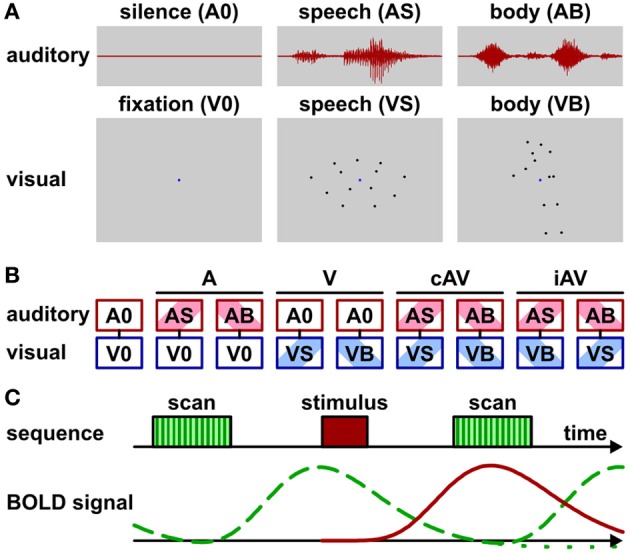
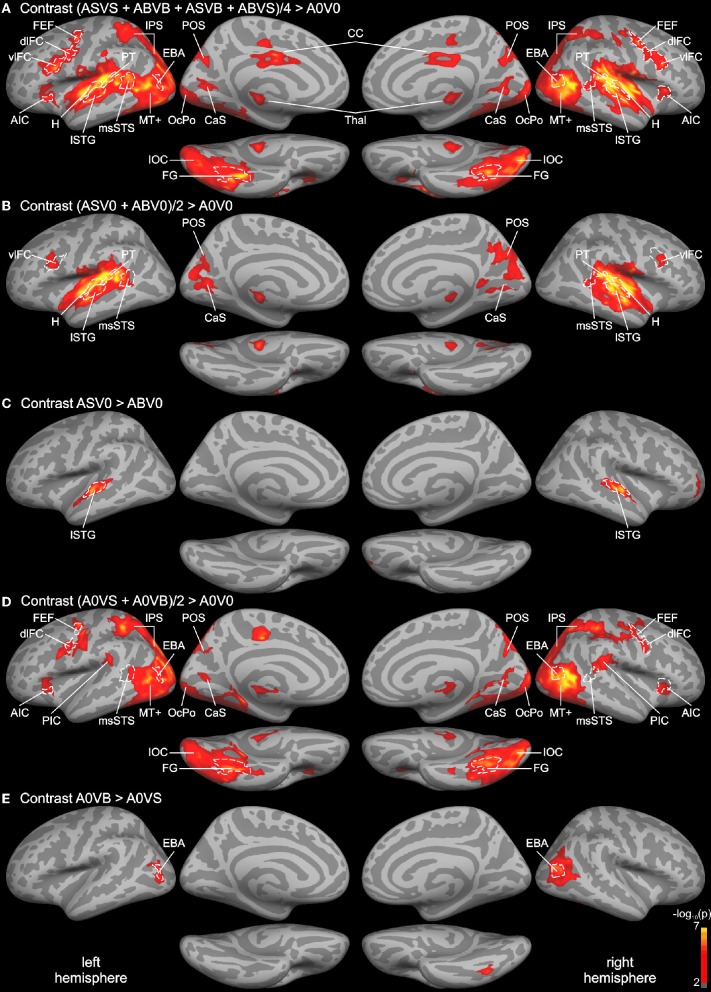
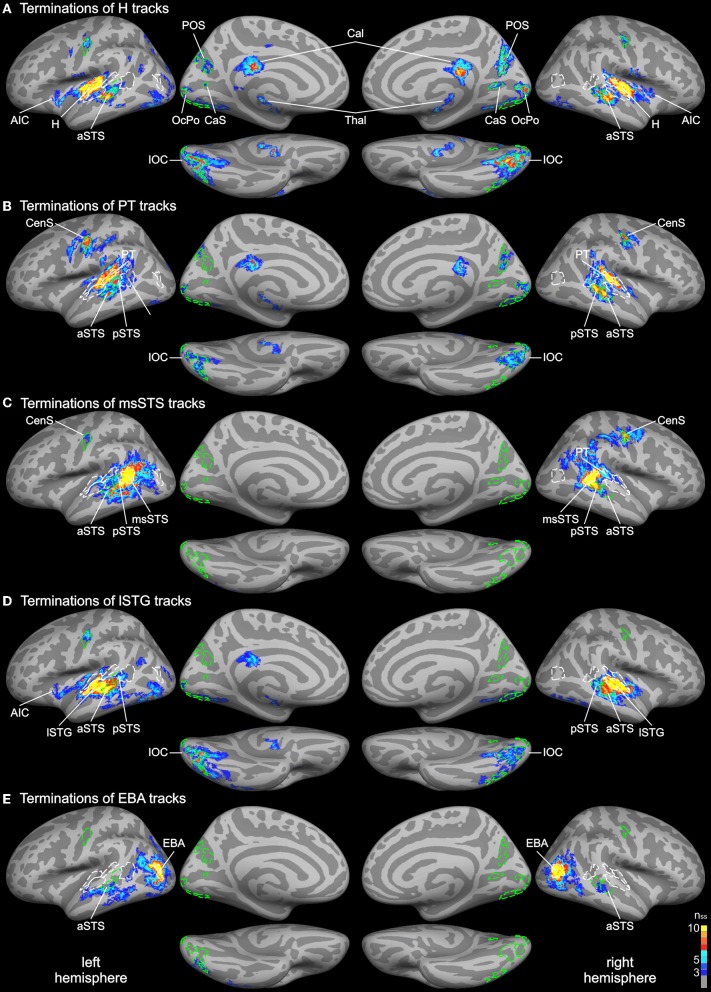
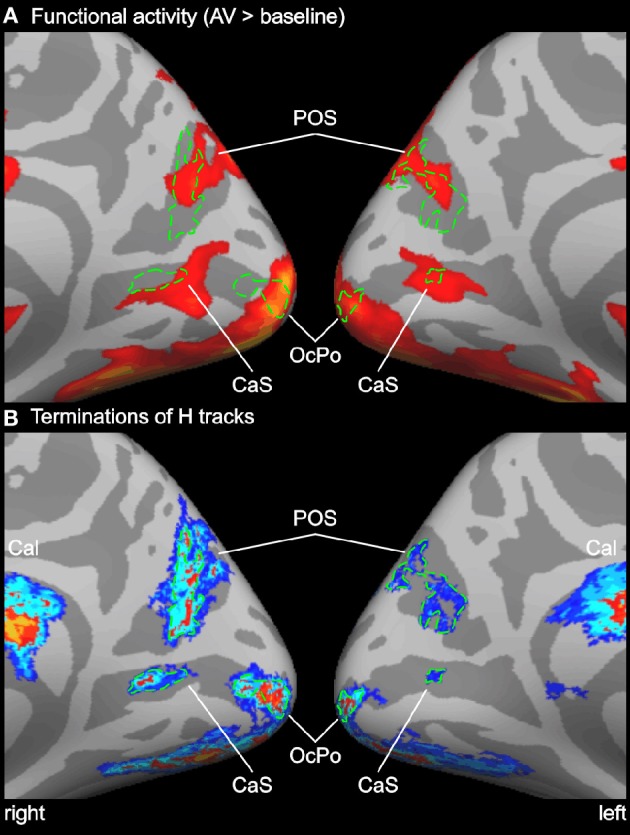
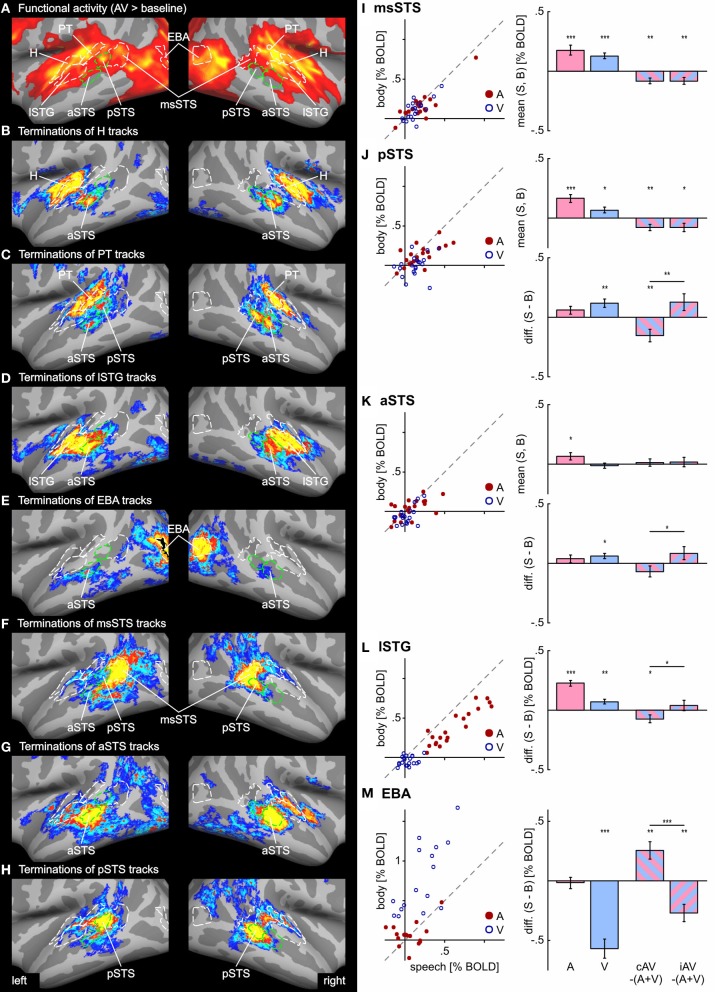
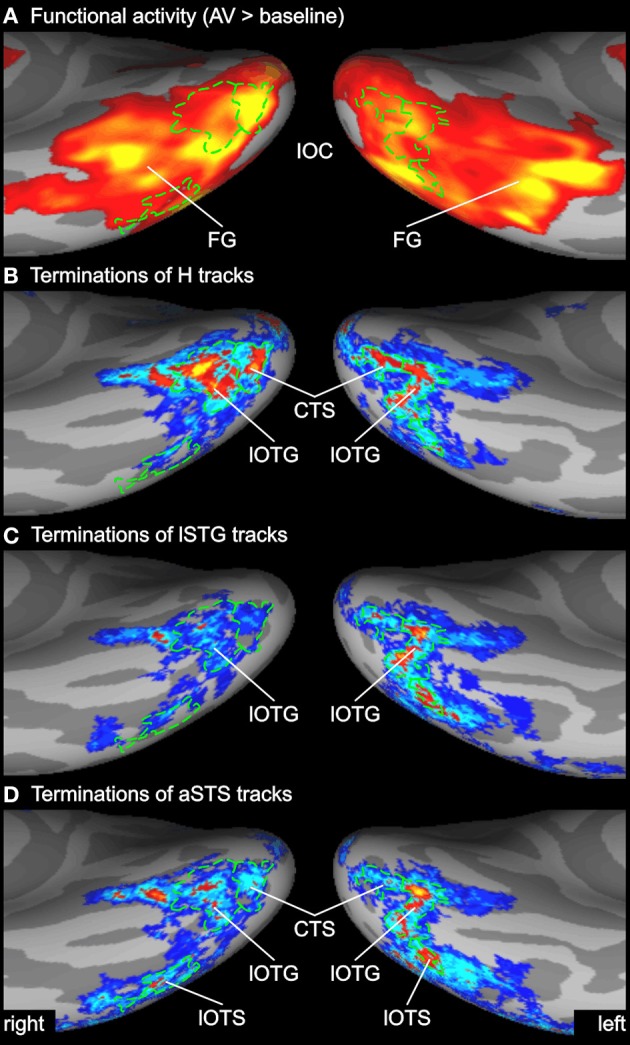
Functional magnetic resonance imaging (MRI) showed that the superior temporal and occipital cortex are involved in multisensory integration. Probabilistic fiber tracking based on diffusion-weighted MRI suggests that multisensory processing is supported by white matter connections between auditory cortex and the temporal and occipital lobe. Here, we present a combined functional MRI and probabilistic fiber tracking study that reveals multisensory processing mechanisms that remained undetected by either technique alone. Ten healthy participants passively observed visually presented lip or body movements, heard speech or body action sounds, or were exposed to a combination of both. Bimodal stimulation engaged a temporal-occipital brain network including the multisensory superior temporal sulcus (msSTS), the lateral superior temporal gyrus (lSTG), and the extrastriate body area (EBA). A region-of-interest (ROI) analysis showed multisensory interactions (e.g., subadditive responses to bimodal compared to unimodal stimuli) in the msSTS, the lSTG, and the EBA region. Moreover, sounds elicited responses in the medial occipital cortex. Probabilistic tracking revealed white matter tracts between the auditory cortex and the medial occipital cortex, the inferior occipital cortex (IOC), and the superior temporal sulcus (STS). However, STS terminations of auditory cortex tracts showed limited overlap with the msSTS region. Instead, msSTS was connected to primary sensory regions via intermediate nodes in the temporal and occipital cortex. Similarly, the lSTG and EBA regions showed limited direct white matter connections but instead were connected via intermediate nodes. Our results suggest that multisensory processing in the STS is mediated by separate brain areas that form a distinct network in the lateral temporal and inferior occipital cortex.
Keywords: DWI; auditory cortex; extrastriate body area; fMRI; fiber tractography; multisensory processing; structural connectivity; superior temporal sulcus.
Figures
Similar articles
-
The connectivity signature of co-speech gesture integration: The superior temporal sulcus modulates connectivity between areas related to visual gesture and auditory speech processing.Neuroimage. 2018 Nov 1;181:539-549. doi: 10.1016/j.neuroimage.2018.07.037. Epub 2018 Jul 17. Neuroimage. 2018. PMID: 30025854
-
White Matter Connectivity of the Visual-Vestibular Cortex Examined by Diffusion-Weighted Imaging.Brain Connect. 2018 May;8(4):235-244. doi: 10.1089/brain.2017.0544. Epub 2018 Apr 25. Brain Connect. 2018. PMID: 29571264
-
Audiovisual functional magnetic resonance imaging adaptation reveals multisensory integration effects in object-related sensory cortices.J Neurosci. 2010 Mar 3;30(9):3370-9. doi: 10.1523/JNEUROSCI.5074-09.2010. J Neurosci. 2010. PMID: 20203196 Free PMC article.
-
Stimulus-dependent activations and attention-related modulations in the auditory cortex: a meta-analysis of fMRI studies.Hear Res. 2014 Jan;307:29-41. doi: 10.1016/j.heares.2013.08.001. Epub 2013 Aug 11. Hear Res. 2014. PMID: 23938208 Review.
-
See me, hear me, touch me: multisensory integration in lateral occipital-temporal cortex.Curr Opin Neurobiol. 2005 Apr;15(2):145-53. doi: 10.1016/j.conb.2005.03.011. Curr Opin Neurobiol. 2005. PMID: 15831395 Review.
Cited by
-
Is the extrastriate body area part of the dorsal visuomotor stream?Brain Struct Funct. 2018 Jan;223(1):31-46. doi: 10.1007/s00429-017-1469-0. Epub 2017 Jul 12. Brain Struct Funct. 2018. PMID: 28702735 Free PMC article.
-
Exploring the Pattern Associated With Longitudinal Changes of β-Amyloid Deposition During Cognitively Normal Healthy Aging.Front Med (Lausanne). 2021 Jan 13;7:617173. doi: 10.3389/fmed.2020.617173. eCollection 2020. Front Med (Lausanne). 2021. PMID: 33585514 Free PMC article.
-
Identifying EEG biomarkers of sense of embodiment in virtual reality: insights from spatio-spectral features.Front Neuroergon. 2025 May 12;6:1572851. doi: 10.3389/fnrgo.2025.1572851. eCollection 2025. Front Neuroergon. 2025. PMID: 40420994 Free PMC article.
-
Passive reading and motor imagery about hand actions and tool-use actions: an fMRI study.Exp Brain Res. 2014 Feb;232(2):453-67. doi: 10.1007/s00221-013-3753-4. Epub 2013 Nov 14. Exp Brain Res. 2014. PMID: 24232859
-
Meta-analytic connectivity modeling of the human superior temporal sulcus.Brain Struct Funct. 2017 Jan;222(1):267-285. doi: 10.1007/s00429-016-1215-z. Epub 2016 Mar 22. Brain Struct Funct. 2017. PMID: 27003288 Free PMC article.
References
-
- Basser P. J., Mattiello J., Lebihan D. (1994). Estimation of the effective self-diffusion tensor from the NMR spin echo. J. Magn. Reson. B 103, 247–254 - PubMed
LinkOut - more resources
Full Text Sources
Other Literature Sources