. 2013 Feb 13;33(7):2889-99.
doi: 10.1523/JNEUROSCI.3554-12.2013.

The convergence of maturational change and structural covariance in human cortical networks

Affiliations

The convergence of maturational change and structural covariance in human cortical networks

Aaron Alexander-Bloch et al. J Neurosci. .

Abstract

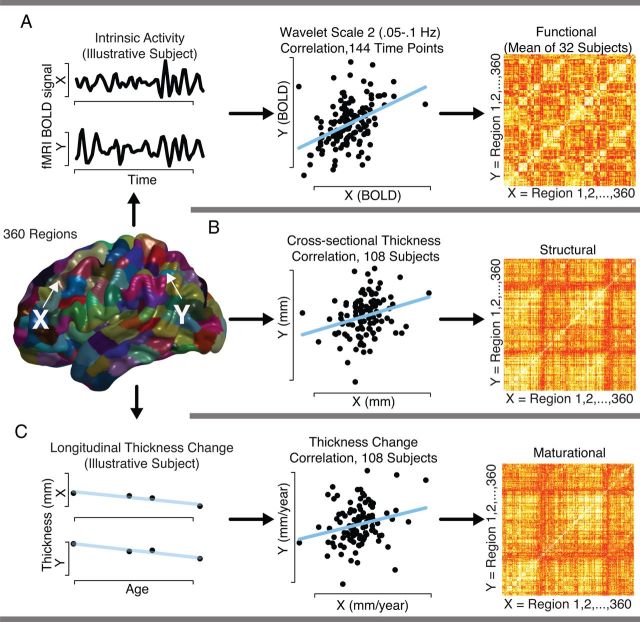
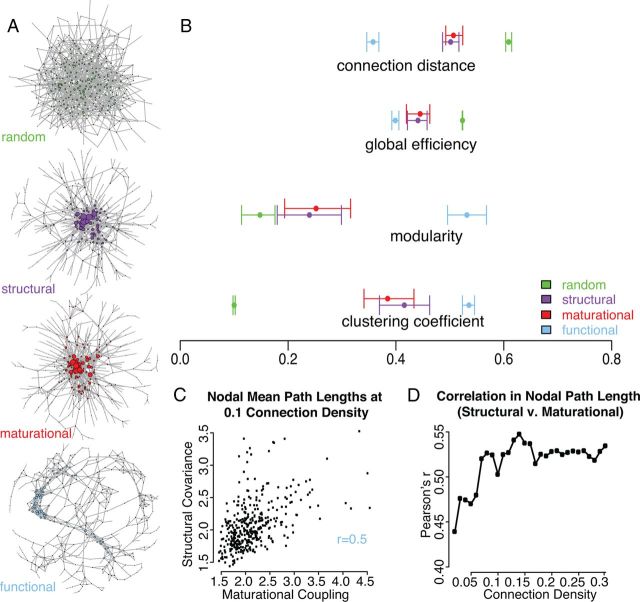
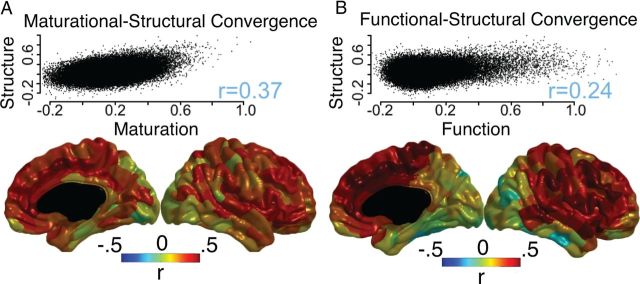
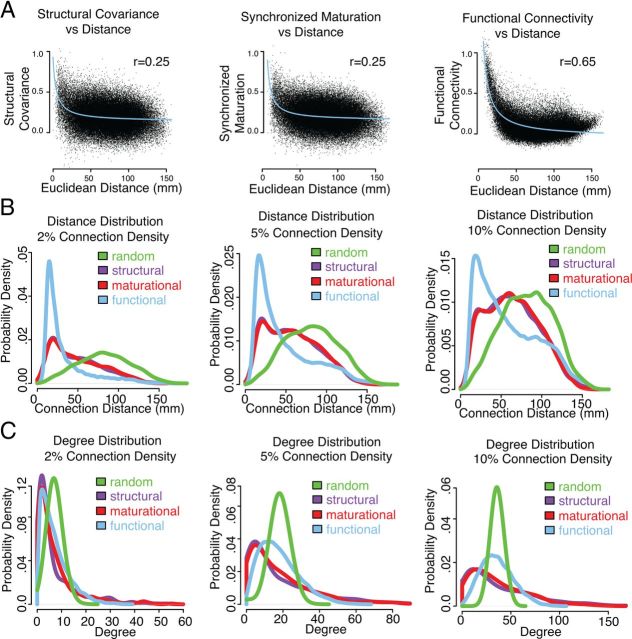
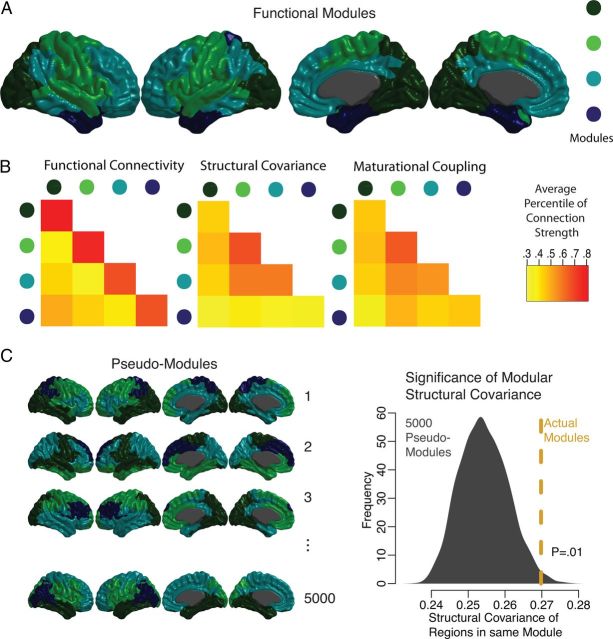
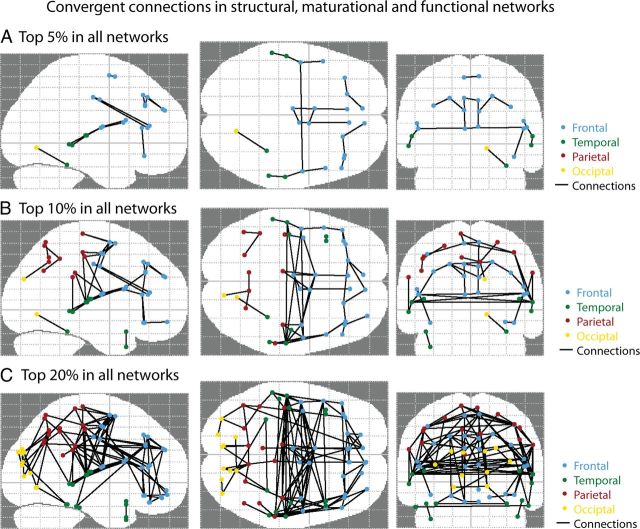
Large-scale covariance of cortical thickness or volume in distributed brain regions has been consistently reported by human neuroimaging studies. The mechanism of this population covariance of regional cortical anatomy has been hypothetically related to synchronized maturational changes in anatomically connected neuronal populations. Brain regions that grow together, i.e., increase or decrease in volume at the same rate over the course of years in the same individual, are thus expected to demonstrate strong structural covariance or anatomical connectivity across individuals. To test this prediction, we used a structural MRI dataset on healthy young people (N = 108; aged 9-22 years at enrollment), comprising 3-6 longitudinal scans on each participant over 6-12 years of follow-up. At each of 360 regional nodes, and for each participant, we estimated the following: (1) the cortical thickness in the median scan and (2) the linear rate of change in cortical thickness over years of serial scanning. We constructed structural and maturational association matrices and networks from these measurements. Both structural and maturational networks shared similar global and nodal topological properties, as well as mesoscopic features including a modular community structure, a relatively small number of highly connected hub regions, and a bias toward short distance connections. Using resting-state functional magnetic resonance imaging data on a subset of the sample (N = 32), we also demonstrated that functional connectivity and network organization was somewhat predictable by structural/maturational networks but demonstrated a stronger bias toward short distance connections and greater topological segregation. Brain structural covariance networks are likely to reflect synchronized developmental change in distributed cortical regions.


Figures

Figure 1.
Figure 1.
Schematic illustration of the estimation of the three types of brain connectivity, between the same 360 cortical regions: functional connectivity, structural covariance, and synchronized maturational change. A, For functional connectivity, wavelet correlations of intrinsic activity at 0.05–0.1 Hz were calculated between every pair of regions and averaged across subjects. B, For structural covariance, each region's cortical thickness was estimated using the median scan in terms of age of acquisition for each subject, and pairwise correlations across subjects were calculated after regressing out linear effects of age and gender. C, For synchronized maturational change, each region's slope of maturation with age was calculated via linear regression for each subject, using all scans acquired in the age range 9–22, and pairwise correlations in the rate of maturation were calculated across subjects.
Figure 2.
Figure 2.
Topological characteristics of multimodal brain networks constructed from the strongest connections in each modality. A, Topological layouts using the same force-directed algorithm (Csardi and Nepusz, 2006) for all networks thresholded at a sparse 2% connection density, as well as a random graph with the same number of nodes and edges. B, Global topological properties of the networks at 10% connection density, with bootstrapped 95% confidence intervals generated by resampling 5000 times with replacement across subjects. C, Nodal average path length for structural versus maturational networks at 10% connection density. D, Correlation coefficient of nodal average path length for structural versus maturational networks, across a range of connection densities.
Figure 3.
Figure 3.
Association between structural covariance, maturational coupling, and functional connectivity. A, The correlation between structural covariance and maturational coupling, across all pairs of brain regions (scatterplot) and for each region separately. B, The correlation between structural covariance and functional connectivity across all pairs of brain regions (scatterplot) and for each region separately.
Figure 4.
Figure 4.
Network profiles of edge connection distance and nodal degree distributions. A, Across all pairs of brain regions, connection distance is inversely proportional to structural covariance, synchronized maturational change, and functional connectivity. B, At three different connection densities, connection distance probability distributions for structural, maturational, functional, and benchmark random networks. C, At three different connection densities, nodal degree probability distributions for structural, maturational, functional, and benchmark random networks.
Figure 5.
Figure 5.
Structural covariance and maturational coupling of functional modular communities. A, Population-level functional communities based on 100 runs of a simulated annealing algorithm to maximize network modularity, at 10% connection density. B, The average functional connectivity, structural covariance, and maturational coupling, within and between the functional communities. C, The structural covariance within functional communities tested using a permutation procedure. Five thousand pseudo-modules were generated having the same number of spatially contiguous clusters as the actual modules and similar symmetry about the midline.
Figure 6.
Figure 6.
Pairs of brain regions that are strongly connected in all three of the networks under study: structural, maturational, and functional. The conjunction map of correlations that are among the strongest 5% (A), 10% (B), and 20% (C) in all three networks. All of the correlations shown are significant in each of the three networks using an FDR-adjusted p < 0.0001 (Benjamani et al., 2006). Visualization was performed in MATLAB using the Network Based Statistics Toolbox (Zalesky et al., 2010). Anatomical labels were defined using the AAL atlas (Tzourio-Mazoyer et al., 2002).

References

    1. Adachi Y, Osada T, Sporns O, Watanabe T, Matsui T, Miyamoto K, Miyashita Y. Functional connectivity between anatomically unconnected areas is shaped by collective network-level effects in the macaque cortex. Cereb Cortex. 2012;22:1586–1592. - PubMed
    1. Alexander-Bloch AF, Gogtay N, Meunier D, Birn R, Clasen L, Lalonde F, Lenroot R, Giedd J, Bullmore ET. Disrupted modularity and local connectivity of brain functional networks in childhood-onset schizophrenia. Front Syst Neurosci. 2010;4:147. - PMC - PubMed
    1. Alexander-Bloch AF, Vértes PE, Stidd R, Lalonde F, Clasen L, Rapoport J, Giedd J, Bullmore ET, Gogtay N. The anatomical distance of functional connections predicts brain network topology in health and schizophrenia. Cereb Cortex. 2013;23:127–138. - PMC - PubMed
    1. Alexander-Bloch A, Lambiotte R, Roberts B, Giedd J, Gogtay N, Bullmore E. The discovery of population differences in network community structure: new methods and applications to brain functional networks in schizophrenia. Neuroimage. 2012;59:3889–3900. - PMC - PubMed
    1. Andrews TJ, Halpern SD, Purves D. Correlated size variations in human visual cortex, lateral geniculate nucleus, and optic tract. J Neurosci. 1997;17:2859–2868. - PMC - PubMed

Publication types

LinkOut - more resources