. 2013 Feb 13;33(7):2984-93.
doi: 10.1523/JNEUROSCI.3596-12.2013.

The inhibition of neurons in the central nervous pathways for thermoregulatory cold defense induces a suspended animation state in the rat

Affiliations

The inhibition of neurons in the central nervous pathways for thermoregulatory cold defense induces a suspended animation state in the rat

Matteo Cerri et al. J Neurosci. .

Abstract

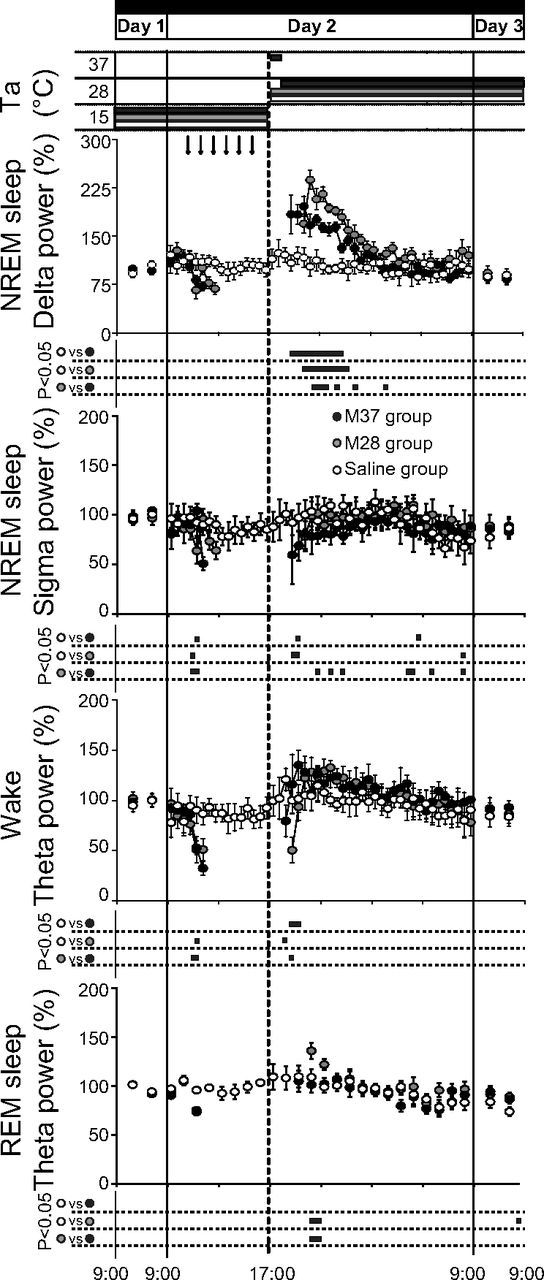
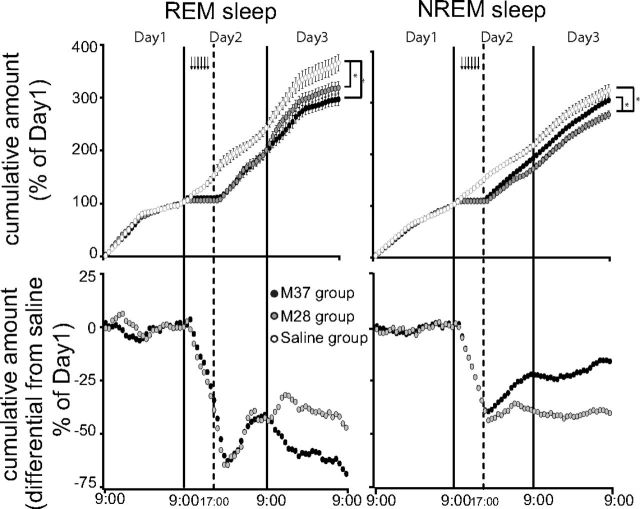
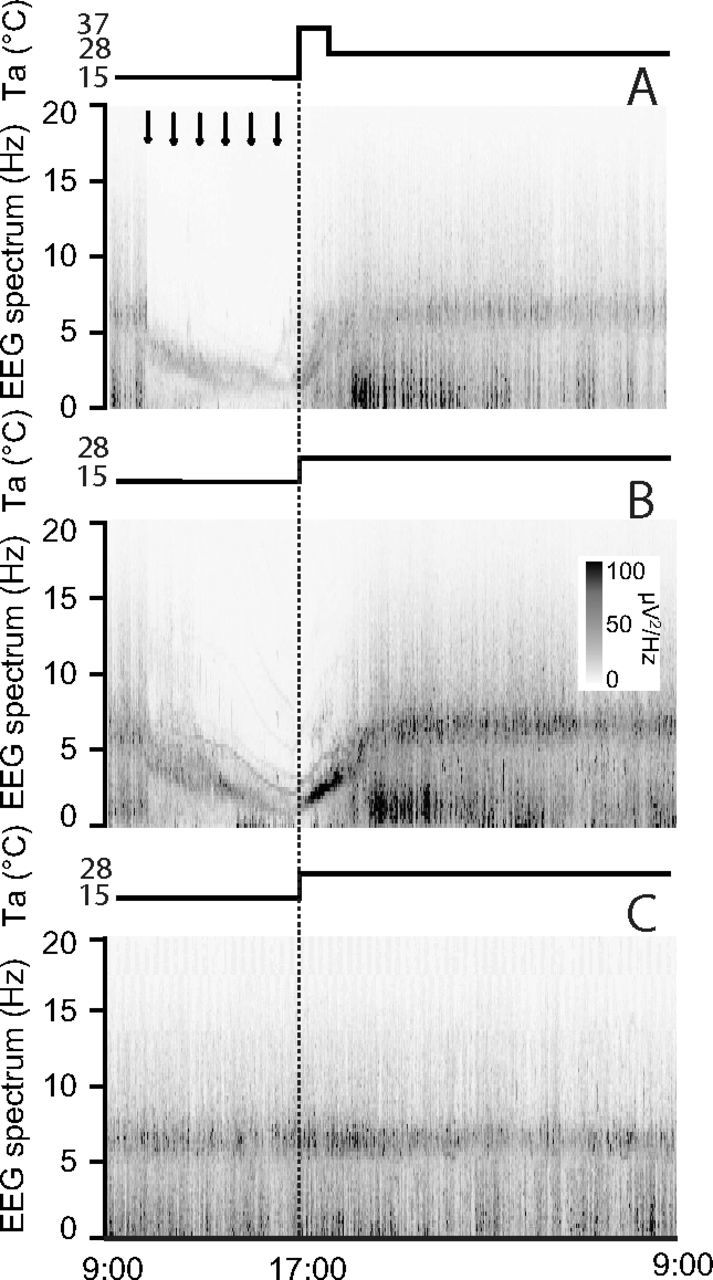
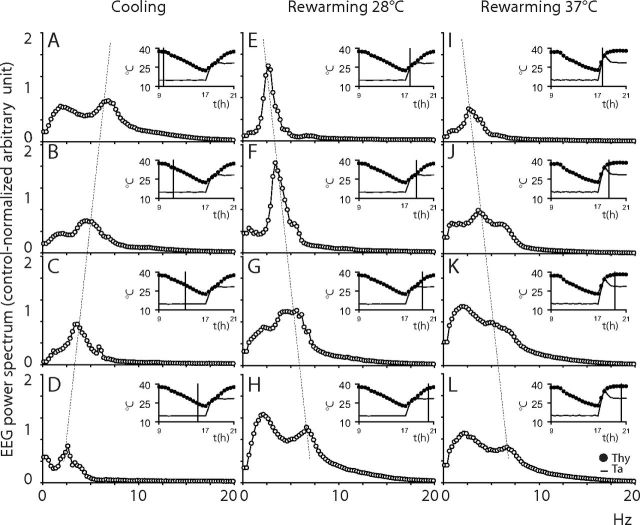
The possibility of inducing a suspended animation state similar to natural torpor would be greatly beneficial in medical science, since it would avoid the adverse consequence of the powerful autonomic activation evoked by external cooling. Previous attempts to systemically inhibit metabolism were successful in mice, but practically ineffective in nonhibernators. Here we show that the selective pharmacological inhibition of key neurons in the central pathways for thermoregulatory cold defense is sufficient to induce a suspended animation state, resembling natural torpor, in a nonhibernator. In rats kept at an ambient temperature of 15°C and under continuous darkness, the prolonged inhibition (6 h) of the rostral ventromedial medulla, a key area of the central nervous pathways for thermoregulatory cold defense, by means of repeated microinjections (100 nl) of the GABA(A) agonist muscimol (1 mm), induced the following: (1) a massive cutaneous vasodilation; (2) drastic drops in deep brain temperature (reaching a nadir of 22.44 ± 0.74°C), heart rate (from 440 ± 13 to 207 ± 12 bpm), and electroencephalography (EEG) power; (3) a modest decrease in mean arterial pressure; and (4) a progressive shift of the EEG power spectrum toward slow frequencies. After the hypothermic bout, all animals showed a massive increase in NREM sleep Delta power, similarly to that occurring in natural torpor. No behavioral abnormalities were observed in the days following the treatment. Our results strengthen the potential role of the CNS in the induction of hibernation/torpor, since CNS-driven changes in organ physiology have been shown to be sufficient to induce and maintain a suspended animation state.


Figures

Figure 1.
Figure 1.
Distribution and location of RVMM injection sites. The location of every injection site (A), marked with fast green at the end of each experimental procedure, is schematically plotted on atlas drawings (Paxinos and Watson, 2007) at four rostrocaudal levels of the RVMM. Distance from bregma is indicated in millimeters under each drawing. Example of marked sites at two different rostrocaudal level are visible in B and C. 7n, nucleus of the VII cranial nerve; IO, inferior olive; Py, pyramids; ROb, raphe obscurus; RPa, raphe pallidus.
Figure 2.
Figure 2.
Example of the suspended animation state induced by repeated injection of muscimol in the RVMM. In an animal exposed to constant darkness at a Ta of 15°C, (A) repeated injection of muscimol in RVMM (black arrows at the top) induced a suspended animation state characterized by a reduction in deep brain temperature (Tbrain), HR, EEG voltage, and a shift of the EEG power spectrum. No major changes in AP were observed. Infrared images at the bottom show the state of cutaneous vasomotion: in the pre-injection period (B), following the first injection of muscimol in RVMM (C), and at the end of treatment (D).
Figure 3.
Figure 3.
EEG and autonomic parameters. In animals exposed to constant darkness and a Ta of 15°C, repeated injections (black arrows at the top) of muscimol (gray-filled and black-filled circles) induced a large decrease in deep brain temperature (Tbrain), HR, and EEG total power, while MAP changed to a much lesser extent. No major effects were observed after repeated injections of saline (Saline group, empty circles; n = 6). After 1 h from the last injection, a rewarming period was started by increasing Ta from 15 to 28°C (M28 group, gray-filled circles; n = 7, n = 6 for Tbrain), or from 15 to 37°C for 1 h, returning to 28°C afterward (M37 group, black-filled circles; n = 6). This induced a rapid increase in Tbrain, HR, EEG, and MAP. Values during Day 1 and Day 3 are expressed as a 12 h average ± SEM, while those for Day 2 are expressed as a 30 min average ± SEM. Statistical significance (p < 0.05) is indicated for each group comparison by a black horizontal bar plotted below each section. The vertical solid lines indicate the end of each experimental day, while the vertical dotted line in the middle corresponds to the beginning of the rewarming period.
Figure 4.
Figure 4.
HLI. In animals exposed to a Ta of 15°C, repeated injections (black arrows at the top) of muscimol (filled circles) in the RVMM induced an increase in tail temperature (Ttail), a decrease in deep brain temperature (Tbrain), and an increase in the HLI, while no effects were evoked by repeated saline injections (empty circles). HLI was calculated by the equation: (Tbrain − Ta)/(Ttail − Ta), using data from the M28 group (n = 7). Values are expressed as a 30 min average ± SEM. Statistical significance (p < 0.05) is indicated by a black horizontal bar plotted below graphs.
Figure 5.
Figure 5.
Sleep parameters. Animals exposed to constant darkness at an ambient temperature (Ta) of 15°C underwent a suspended animation state through repeated injections (black arrows at the top) of muscimol in the RVMM. After 1 h from the last injection, a rewarming period was started by increasing Ta from 15 to 28°C (M28 group, gray-filled circles; n = 7), or from 15 to 37°C for 1 h, returning to 28°C afterward (M37 group, black-filled circles; n = 6). The rewarming induced a large increase in NREM sleep Delta power, but small changes in NREM sleep Sigma power, wakefulness Theta power, and REM sleep Theta power. No major effects were caused by repeated injections of saline (Saline group, empty circles; n = 6). Relative values during Day 1 and Day 3 are expressed as a 12 h average ± SEM, while those for Day 2 are expressed as a 30 min average ± SEM for all variables, except for those of EEG Theta power during REM sleep, which are expressed as a 1 h average ± SEM. Statistical significance (p < 0.05) is indicated for each group comparison by a black horizontal bar plotted below each part. The vertical solid lines at extremes indicate the end of each experimental day, while the vertical dotted line in the middle corresponds to the beginning of the rewarming period.
Figure 6.
Figure 6.
Sleep homeostasis in suspended animation. Animals exposed to constant darkness and to an ambient temperature (Ta) of 15°C underwent a suspended animation state through repeated muscimol injections (black arrows at the top) followed by a rewarming period that was started by increasing Ta from 15 to 28°C (M28 group, gray-filled circles; n = 7), or from 15 to 37°C for 1 h, returning to 28°C afterward (M37 group, black-filled circles; n = 6). Top, The amount of REM sleeps, accumulated in the three experimental days by both M28 and M37 groups, remained significantly lower compared with that of the animals repeatedly injected with saline (Saline group, empty circles; n = 6). In contrast, the accumulated amount of NREM sleep was significantly lower than that of the Saline group only for the M28 group. In Day 3 the M37 group accumulated less REM sleep and more NREM sleep than the M28 group. Bottom, Differences between the cumulative amount of REM sleep or NREM sleep in the M28 and the saline group, and the M37 and the saline group. These show that on Day 3 the M28 group produces the same amount of REM and NREM sleep as the saline group, while the M37 group produces less REM sleep and more NREM sleep than the saline group. Values are expressed as a 60 min average ± SEM. Sleep amounts are normalized on the respective average amount of Day 1. The vertical solid lines indicate the end of each experimental day, while the vertical dotted line corresponds to the beginning of the rewarming period. (*p < 0.05).
Figure 7.
Figure 7.
EEG power spectra. In animals exposed to constant darkness and an ambient temperature (Ta) of 15°C repeated injections (black arrows at the top) of muscimol (A, B) induced an evident shift of the EEG power spectrum toward slow frequencies, while repeated injections of saline (C; n = 6) did not modify the EEG spectrum. The increase of Ta from 15 to 28°C (M28 group, B; n = 7) or from 15 to 37°C for 1 h, returning to 28°C afterward (M37 group, A; n = 6) induced a rapid shift of the EEG spectrum toward fast frequencies, followed by a large increase in the power of the Delta band. Also, the M28 group (B) showed during the rewarming period a sharp increase in the power of the part of the spectrum giving origin to the Theta band at the end of the rewarming period. No major effects were induced by rewarming in the Saline group. EEG power spectrum was normalized to the average total EEG power of Day 1. Values are given per seconds with a resolution of 0.25 Hz. The vertical dotted lines indicate the beginning of the rewarming period.
Figure 8.
Figure 8.
Shift of the EEG power spectrum. In animals exposed to an ambient temperature (Ta) of 15°C, the EEG spectrum showed, during the cooling induced by muscimol injections (data from the M28 group (n = 7), A–D), a progressive reduction of the main spectral components and a progressive shift toward slow frequencies. The rewarming at Ta 28°C (M28 group (n = 7), E–H) induced an immediate large increase in the power of the main spectral component and a progressive shift of the spectrum toward fast frequencies. The rewarming at Ta 37°C for 1 h returning to 28°C afterward (M37 group (n = 6), I–L) induced a progressive shift of the spectrum toward fast frequencies. EEG power spectrum is expressed as the 1 h average spectrum (0.25 Hz resolution) calculated at the time shown by the vertical line in inserts. Inserts show the average time course of deep brain temperature (Tbrain, filled circles) and Ta (continuous line) for a 12 h period (9:00–21:00) during the Injection Day. Vertical dotted lines highlight the temperature-dependent shift in the peak of the EEG Theta band during cooling at Ta 15°C and rewarming at Ta 28°C and Ta 37°C.

References

    1. Amici R, Cerri M, Ocampo-Garcés A, Baracchi F, Dentico D, Jones CA, Luppi M, Perez E, Parmeggiani PL, Zamboni G. Cold exposure and sleep in the rat: REM sleep homeostasis and body size. Sleep. 2008;31:708–715. - PMC - PubMed
    1. Andrews MT. Advances in molecular biology of hibernation in mammals. Bioessays. 2007;29:431–440. - PubMed
    1. Berger RJ. Cooling down to hibernate: sleep and hibernation constitute a physiological continuum of energy conservation. Neurosci Lett. 1993;154:213–216. - PubMed
    1. Blackstone E, Morrison M, Roth MB. H2S induces a suspended animation-like state in mice. Science. 2005;308:518. - PubMed
    1. Blessing WW, Nalivaiko E. Raphe magnus/pallidus neurons regulate tail but not mesenteric arterial blood flow in rats. Neuroscience. 2001;105:923–929. - PubMed

Publication types

MeSH terms