. 2013 Feb 13;33(7):3079-93.
doi: 10.1523/JNEUROSCI.3430-12.2013.

A novel role of cytosolic protein synthesis inhibition in aminoglycoside ototoxicity

Affiliations

A novel role of cytosolic protein synthesis inhibition in aminoglycoside ototoxicity

Shimon P Francis et al. J Neurosci. .

Abstract

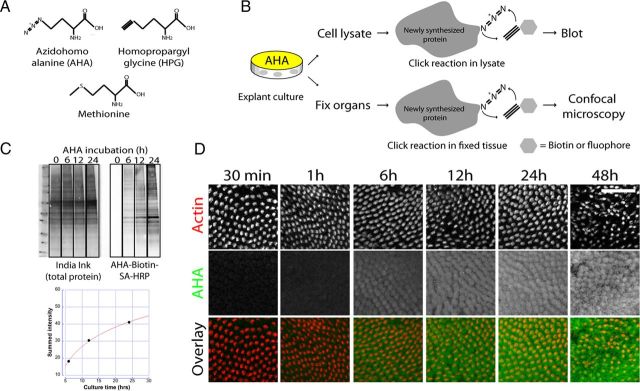
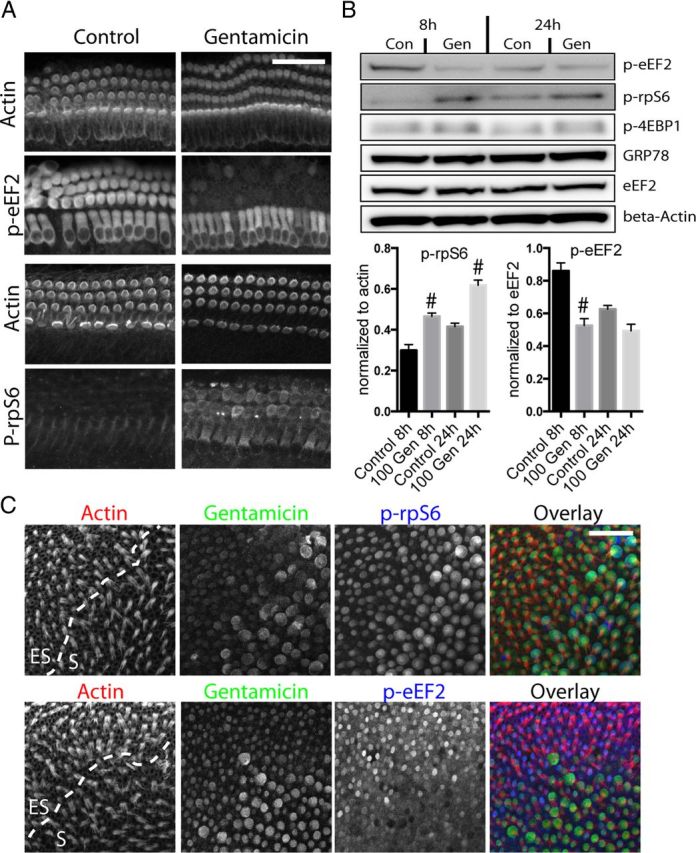
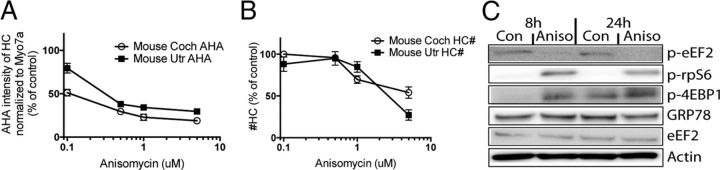
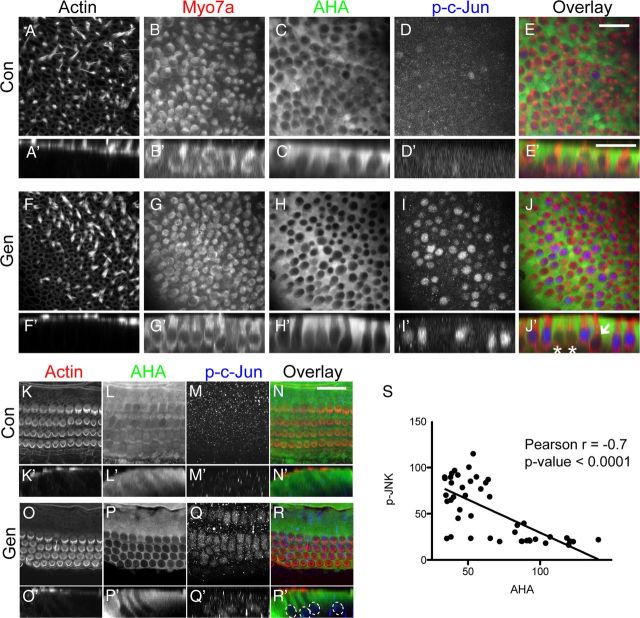
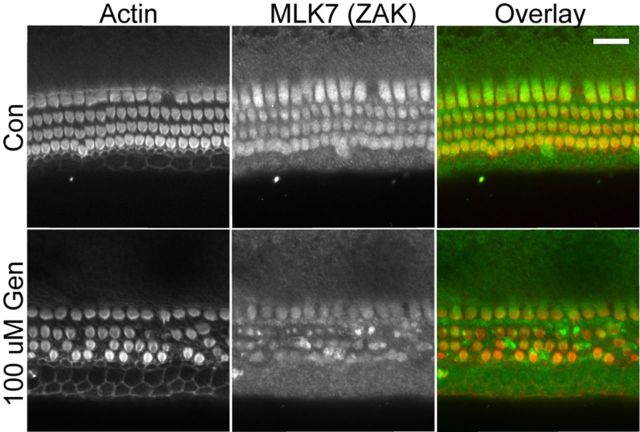
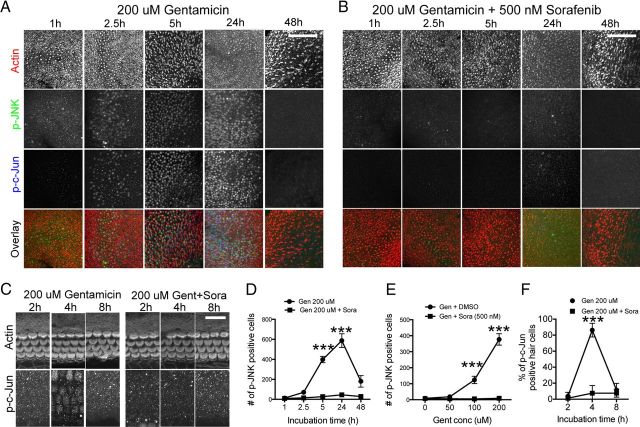
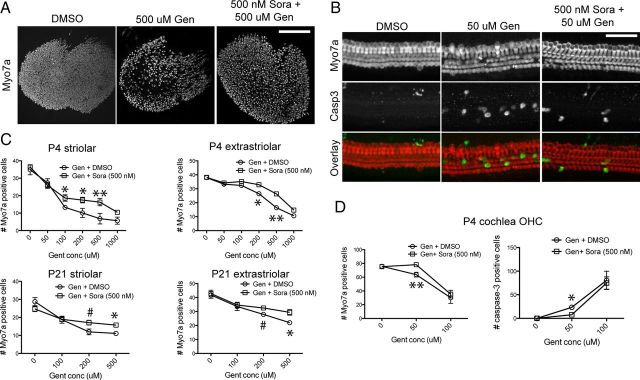
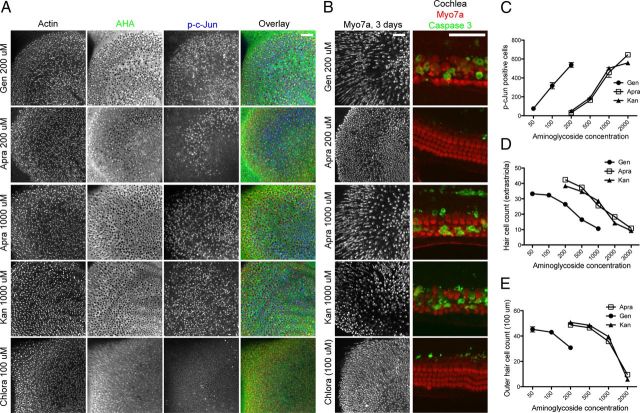
Ototoxicity is a main dose-limiting factor in the clinical application of aminoglycoside antibiotics. Despite longstanding research efforts, our understanding of the mechanisms underlying aminoglycoside ototoxicity remains limited. Here we report the discovery of a novel stress pathway that contributes to aminoglycoside-induced hair cell degeneration. Modifying the previously developed bioorthogonal noncanonical amino acid tagging method, we used click chemistry to study the role of protein synthesis activity in aminoglycoside-induced hair cell stress. We demonstrate that aminoglycosides inhibit protein synthesis in hair cells and activate a signaling pathway similar to ribotoxic stress response, contributing to hair cell degeneration. The ability of a particular aminoglycoside to inhibit protein synthesis and to activate the c-Jun N-terminal kinase (JNK) pathway correlated well with its ototoxic potential. Finally, we report that a Food and Drug Administration-approved drug known to inhibit ribotoxic stress response also prevents JNK activation and improves hair cell survival, opening up novel strategies to prevent and treat aminoglycoside ototoxicity.


Figures

Figure 1.
Figure 1.
Click chemistry can be used to monitor protein synthesis in inner ear sensory epithelia. A, Chemical structures of methionine analogs AHA and HPG. B, Diagram illustrating the experimental procedure of BONCAT: Cultures maintained in methionine-free medium were incubated in AHA (or HPG, not shown here) and further processed for click-chemistry reaction followed by immunoblot or immunolabeling. C, Immunoblot analysis of AHA incorporation shows a time-dependent increase of AHA in newly synthesized proteins in the chick BP. D, Click-chemistry allows for analysis of protein synthesis on a cell-to-cell basis. BP treated with AHA for various periods of time and analyzed by confocal microscopy confirm time-dependent increases in AHA (green) incorporation in hair cells (red). Scale bar: 50 μm.
Figure 2.
Figure 2.
Protein synthesis in inner ear sensory epithelia varies between species and organs. A–E, Immunolabeling for AHA (24 h) was performed in auditory and vestibular organs from chick (Chi) and mouse (Mo). A, AHA incorporation in chick BP hair cells (red) was higher when compared to adjacent supporting cells. However, hair cells from neonatal mouse cochlear explants (C) displayed lower protein synthesis when compared with neighboring supporting cells. In vestibular organs of both species (B, chick E20; D, mouse P4; E, mouse P21), protein synthesis activity was higher in supporting cells compared to hair cells, except for some small, presumably immature hair cells in neonatal mouse utricle where AHA incorporation was high (D, arrows). Scale bar: 20 μm.
Figure 3.
Figure 3.
The effect of culture shock on protein synthesis in explanted sensory epithelium. A, AHA incorporation in mouse cochlea and utricle, and chick utricle explants without preculture period appeared similar to precultured explants. B, AHA incorporation (12 h; green) in chick BP that were not precultured. Most hair cells (red) displayed robust AHA immunoreactivity, but a few had little to no AHA incorporation (inset). C, Dual labeling with AHA and HPG was used to monitor temporal changes in protein synthesis activity after establishment of the explant culture. Explants were pulse labeled with AHA (green) for 24 h and subsequently with HPG (blue) for an additional 24 h. The majority of hair cells displaying initial translational arrest were found to have significant HPG incorporation in the subsequent 24 h. We occasionally identified hair cells that remained in a state of translational arrest (arrowhead). Scale bars: A, B, 20 μm; C, 10 μm.
Figure 4.
Figure 4.
Aminoglycoside antibiotic gentamicin induces translational arrest in sensory hair cells. A, AHA incorporation (24 h) in chick and mouse auditory and vestibular explant cultures, maintained in AHA-supplemented culture medium and exposed to 100 μm gentamicin or vehicle. When exposed to gentamicin, hair cells in all organs showed significant decreases in protein synthesis, while supporting cell protein synthesis was unchanged. Scale bars: 20 μm. B, Quantification of AHA incorporation (relative to PV3 immunoreactivity) in chick BP and utricle hair cells (HC) and supporting cells (SC) exposed to gentamicin or vehicle (n = 6–8; top). Quantification of AHA incorporation (relative to Myo7a immunoreactivity) in mouse inner (IHCs) and outer hair cells (OHCs) and utricle hair cells exposed to gentamicin or vehicle (n = 5–11; bottom). C, AHA incorporation (AHA immunoreactivity in hair cells, normalized to PV3 in chick or Myo7a in mouse, in percentage relative to vehicle control) as a function of gentamicin concentration in growth medium. Organs were cultured for 24 h. D, Hair cell numbers (phalloidin positive) in chick and mouse auditory and vestibular explants as a function of gentamicin concentration in growth medium. Organs were cultured for 24 h. *p < 0.01; **p < 0.001; ***p < 0.0001.
Figure 5.
Figure 5.
Gentamicin (Gen) exposure activates the mTOR pathway in hair cells. A, Immunocytochemistry for mTOR substrates indicated that exposure to gentamicin (100 μm) results in decreased phosphorylation of eEF2 and increased phosphorylation of rpS6 (most evident between 4–8 h after start of gentamicin exposure) in mouse cochlea hair cells, consistent with mTOR activation. B, Immunoblot analysis and quantification of mTOR substrate phosphorylation status also shows a significant increase in p-rpS6 and reduction of p-eEF2 in cochlea explants treated with 100 μm gentamicin (8 and 24 h; n = 4 experiments). Changes in p-4EBP1 were inconsistent and not significant. Levels of GRP78 (marker for ER stress), unphosphorylated eEF2, and β-actin remained unchanged. #p < 0.05 compared to control conditions. C, P3 mouse utricles were treated with 100 μm gentamicin for 4 h, then double labeled with a gentamicin antibody (green) and antibodies against p-rpS6 (blue, top) or p-eEF2 (blue, bottom). Hair cells (red) with stronger gentamicin immunoreactivity display stronger p-rpS6 (Pearson's r = 0.77; p < 0.05) and lower p-eEF2 immunoreactivity (Pearson's r = −0.64; p < 0.005). More than 100 cells from three different organs were analyzed.
Figure 6.
Figure 6.
Gentamicin binds to and partially colocalizes with eukaryotic rRNA. A, UV-monitored thermal stability analysis demonstrates gentamicin binding to the H69 19 nt hairpin of human 28S rRNA. Unmodified H69 (1 μm) was titrated with increasing concentrations of gentamicin (0–9 μm), and the rRNA/gentamicin complex was subjected to repeated thermal denaturations and renaturations. Each curve is the result of point-by-point averages of six transitions for each concentration. The differences in melting temperatures (ΔTm) of H69 as a function of the gentamicin concentration provided the binding curve (bottom). The Kd of gentamicin to H69 was determined as 1.7 μm. B, Partial colocalization of gentamicin and rRNA immunoreactivity. Mouse cochleae were incubated for 30 min with 100 μm gentamicin and double labeled with a rabbit anti-gentamicin antibody and the mouse monoclonal Y10B antibody that specifically recognizes rRNA (Garden et al., 1994). Gentamicin (red) and Y10B (green) immunoreactivity colocalized in a limited fashion (Pearson correlation coefficient of 0.25, analysis of 50 outer hair cells). Scale bar, 20 μm.
Figure 7.
Figure 7.
The ribotoxin anisomycin causes protein synthesis inhibition, mTOR activation, and cell death in hair cells. A, Mouse cochleae and utricles were exposed to the ribotoxic compound anisomycin at various concentrations for 24 h. Analysis of AHA incorporation showed a significant dose-dependent decrease of protein synthesis in hair cells (n = 5). AHA intensity was normalized to Myo7a immunoreactivity and plotted as the percentage relative to vehicle control. B, Mouse cochleae and utricles were exposed to the same concentrations of anisomycin as in A, and hair cells were counted. Anisomycin induced significant dose-dependent loss of hair cells (n = 5). C, Immunoblot analysis of mTOR substrate phosphorylation status indicated that 1 μm anisomycin (Aniso) activates the mTOR pathway in mouse P4 cochlea cultures (reduction of p-eEF2 and increase of p-rpS6 and p-4EBP1). Con, Control. Comparable results were obtained with mouse utricle cultures.
Figure 8.
Figure 8.
Aminoglycoside-induced JNK activation is correlated with translational arrest. A–J, P4 mouse utricles were incubated in AHA-supplemented medium under control conditions (A–E) or treated with 100 μm gentamicin for 24 h (F–J). A′–J′ are representative profile views (using reslice function in ImageJ). Phalloidin and Myo7a (red) staining indicate hair cells (A, B, F, G), AHA staining indicates protein synthesis activity (C, H, green), and p-c-Jun immunoreactivity indicates JNK activation (D, I, blue). AHA incorporation was lower in hair cells compared to adjacent supporting cells (C), but exposure to gentamicin resulted in a further decrease of hair cell protein synthesis (H). p-c-Jun immunoreactivity was strongly induced by gentamicin compared to control (D, I). The majority of hair cells without p-c-Jun immunoreactivity (J′, asterisks) exhibited higher AHA incorporation than those positive for p-c-Jun. In some cases, hair cells had neither strong p-c-Jun immunoreactivity nor high AHA incorporation (J′, arrow). K–R, JNK activity (p-c-Jun, blue) and AHA incorporation (green) are also correlated (negatively) in mouse cochlea hair cells incubated with 100 μm gentamicin (24 h). K′–R′ are representative profile views. Dotted circles in R′ indicate the locations of p-c-Jun-positive nuclei in outer and inner hair cells. Scale bars: E (for A–J), E′ (for A′–J′), N (for K–R), 25 μm. S, Correlation analysis of JNK activity and AHA incorporation in mouse utricles exposed to 100 μm gentamicin shows significant negative correlation (Pearson's r = −0.7; p < 0.0001).
Figure 9.
Figure 9.
MLK7 is expressed in sensory hair cells. MLK7 (green) is expressed in both inner hair cells and outer hair cells (red) of the neonatal mouse cochlea (P4). Exposure to 100 μm gentamicin (Gen; 24 h) resulted in sporadic loss of outer hair cells and a reduced or condensed pattern of MLK7 immunoreactivity in outer hair cells. Con, Control. Scale bar, 20 μm.
Figure 10.
Figure 10.
Sorafenib inhibits gentamicin-induced JNK activation. A, P4 mouse utricles were exposed to 200 μm gentamicin for various time periods. Immunoreactivity for phosphorylated JNK (green) and c-Jun (blue) in hair cells increased in a time-dependent manner. B, Hair cells from explants pretreated with 500 nm sorafenib displayed a near complete inhibition of JNK activation at all time points analyzed. C, Sorafenib (Sora) also prevents gentamicin (Gen)-induced JNK activation in mouse cochlea cultures. D, Quantification of A and B (JNK immunoreactivity) indicated a near complete suppression of JNK activation in sorafenib treated hair cells at all time points examined (n = 4). E, Sorafenib prevents gentamicin-induced JNK activation across the entire gentamicin dose–response curve (n = 4). F, Quantification of C showing that sorafenib prevents gentamicin-induced JNK activation in mouse cochlea hair cells (n = 4). Asterisks illustrate the significance of difference between gentamicin-only and corresponding gentamicin plus sorafenib samples. p-c-Jun-positive cells were counted in a 320 × 320 μm area of the utricle and in a 200 μm stretch of the basal end of the cochlea. Scale bars: A, B, 100 μm; C, 20 μm. ***p < 0.0001.
Figure 11.
Figure 11.
Sorafenib partially protects against gentamicin (Gen)-induced hair cell death. A, Representative images of mouse utricles exposed to vehicle (DMSO) only and 500 μm gentamicin (24 h), with and without sorafenib (Sora) pretreatment. Hair cells, immunolabeled for Myo7a, were partially protected from gentamicin-induced cell death when pretreated with sorafenib (500 nm). B, P4 mouse cochlea cultures were exposed to 50 μm gentamicin (24 h), with and without sorafenib pretreatment, and immunolabeled for Myo7a (red) and activated caspase-3 (green). Gentamicin induced sporadic loss of OHCs and caspase-3 activation, which was reduced by pretreatment with sorafenib. C, Quantification of striolar and extrastriolar hair cell counts from neonatal (P4) and mature (P21) mouse utricles exposed to concentrations of gentamicin across the dose–response curve. Sorafenib provided significant inhibition of hair cell death in both neonatal and mature utricles at a range of gentamicin concentrations (n > 5). D, Quantification of caspase-3 activation and outer hair cell counts in neonatal mouse cochlea also indicated partial protective effect of sorafenib at 50 μm gentamicin concentration (n > 5). Asterisks illustrate significance of difference between gentamicin-only and corresponding gentamicin plus sorafenib samples. Scale bars: A, 200 μm; B, 50 μm. #p < 0.05; *p < 0.01; **p < 0.001.
Figure 12.
Figure 12.
Hair cell loss correlates with the ability of aminoglycosides to inhibit cytosolic protein synthesis and to activate the JNK pathway. A, P4 mouse utricle cultures were incubated for 24 h in 200 μm gentamicin (Gen), 200 μm apramycin, (Apra), 1000 μm apramycin, 1000 μm kanamycin (Kan), or 100 μm chloramphenicol (Chlora) in AHA-supplemented medium. Hair cells (red) exposed to gentamicin or apramycin exhibited decreased AHA incorporation (green) and increased p-c-Jun immunoreactivity (blue); gentamicin was ∼5- to 10-fold more effective in causing protein synthesis inhibition and JNK activation compared to apramycin (200 μm gentamicin corresponded to >1000 μm apramycin). Kanamycin's ability to inhibit protein synthesis and activate JNK was virtually identical to apramycin's. Exposure to chloramphenicol, an inhibitor of mitochondrial translation, did not result in JNK activation or reduction of protein synthesis (bottom). B, P4 mouse utricle (left) and cochlea (right) cultures were incubated for 72 h (24 h for cochlea) under same conditions as described in A. A concentration of 200 μm gentamicin caused a degree of hair cell loss similar to 1000 μm apramycin and kanamycin in both utricle and cochlea cultures. A concentration of 100 μm chloramphenicol failed to cause any hair cell loss. C, Quantification of A. p-c-Jun-positive hair cells were counted in an area of 300 × 300 μm. Gentamicin is ∼5–10 times more potent in activating JNK, compared to equal concentrations of kanamycin and apramycin. D, E, Quantification of B. Utricle hair cells were counted in three random areas (50 × 50 μm) of the extrastriolar region (n = 4), and cochlea outer hair cells were counted in a 100 μm stretch of the basal end (n = 4). Similar to the JNK activation dose–response curve in C, gentamicin also caused ∼5–10 times more hair cell loss in both utricle and cochlea cultures, compared to equal concentrations of kanamycin and apramycin. Scale bars: 50 μm.
Figure 13.
Figure 13.
In vivo ABR threshold measurements. A, Representative ABR traces of mice systemically treated with furosemide only, 1000 mg/kg apramycin, 1000 mg/kg kanamycin, and 100 mg/kg gentamicin (coinjected with furosemide). B, Summary of ABR measurements. Injection of 1000 mg/kg apramycin (n = 4 mice) or 1000 mg/kg kanamycin (n = 4 mice) produced ABR threshold shifts comparable to the injection of 100 mg/kg gentamicin (n = 4; ∼50 dB) at all measured frequencies. Reduction of injection dose by 40% (600 mg/kg for kanamycin and apramycin, 60 mg/kg for gentamicin) resulted in similar reduction of ABR threshold shift. Furosemide injections alone did not cause a threshold shift.

References

    1. Agard NJ, Prescher JA, Bertozzi CR. A strain-promoted [3 + 2] azide-alkyne cycloaddition for covalent modification of biomolecules in living systems. J Am Chem Soc. 2004;126:15046–15047. - PubMed
    1. Beatty KE, Tirrell DA. Two-color labeling of temporally defined protein populations in mammalian cells. Bioorg Med Chem Lett. 2008;18:5995–5999. - PMC - PubMed
    1. Bedwell DM, Kaenjak A, Benos DJ, Bebok Z, Bubien JK, Hong J, Tousson A, Clancy JP, Sorscher EJ. Suppression of a CFTR premature stop mutation in a bronchial epithelial cell line. Nat Med. 1997;3:1280–1284. - PubMed
    1. Bertolotti A, Zhang Y, Hendershot LM, Harding HP, Ron D. Dynamic interaction of BiP and ER stress transducers in the unfolded-protein response. Nat Cell Biol. 2000;2:326–332. - PubMed
    1. Beugnet A, Tee AR, Taylor PM, Proud CG. Regulation of targets of mTOR (mammalian target of rapamycin) signalling by intracellular amino acid availability. Biochem J. 2003;372:555–566. - PMC - PubMed

Publication types

MeSH terms