. 2013 Feb 13;33(7):3164-77.
doi: 10.1523/JNEUROSCI.1046-12.2013.

Selective optogenetic activation of rostral ventrolateral medullary catecholaminergic neurons produces cardiorespiratory stimulation in conscious mice

Affiliations

Selective optogenetic activation of rostral ventrolateral medullary catecholaminergic neurons produces cardiorespiratory stimulation in conscious mice

Stephen B G Abbott et al. J Neurosci. .

Abstract

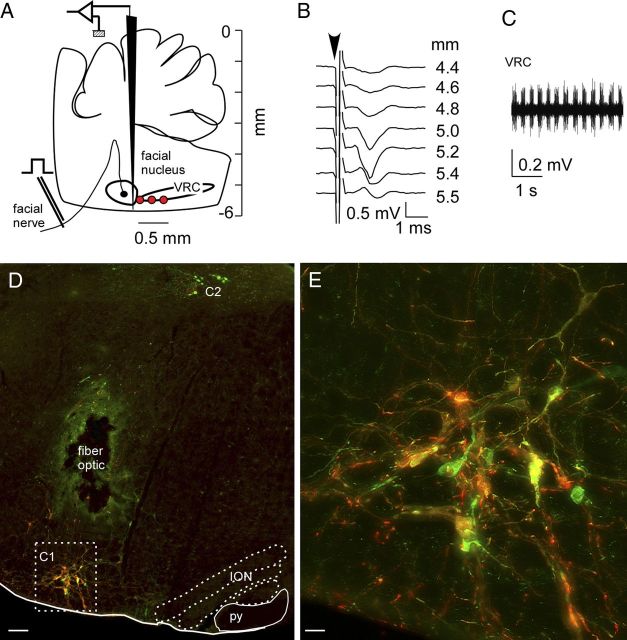
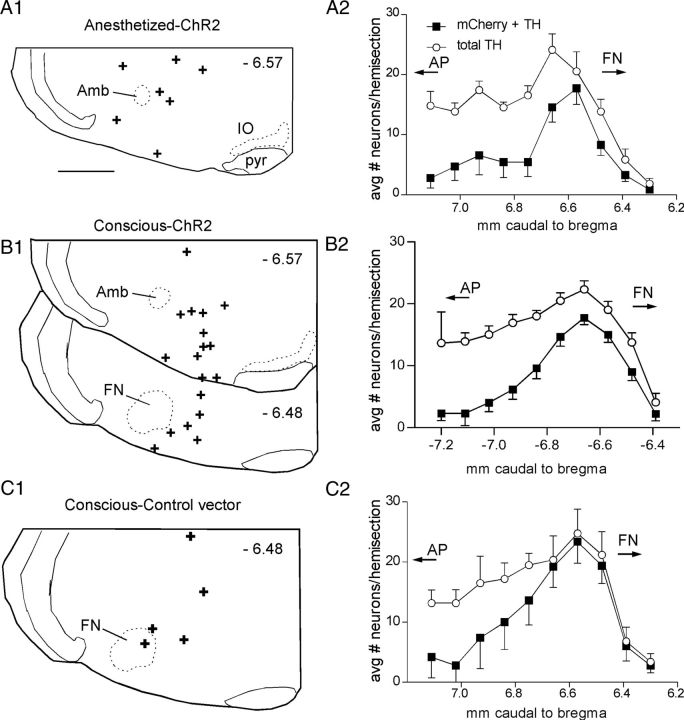
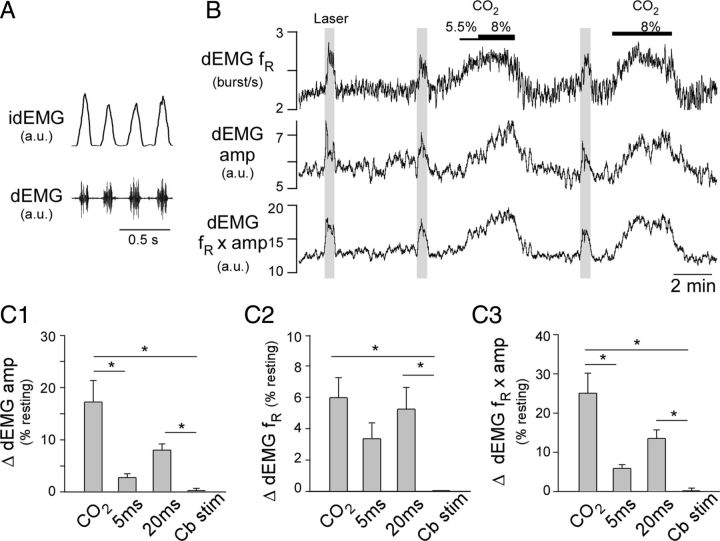
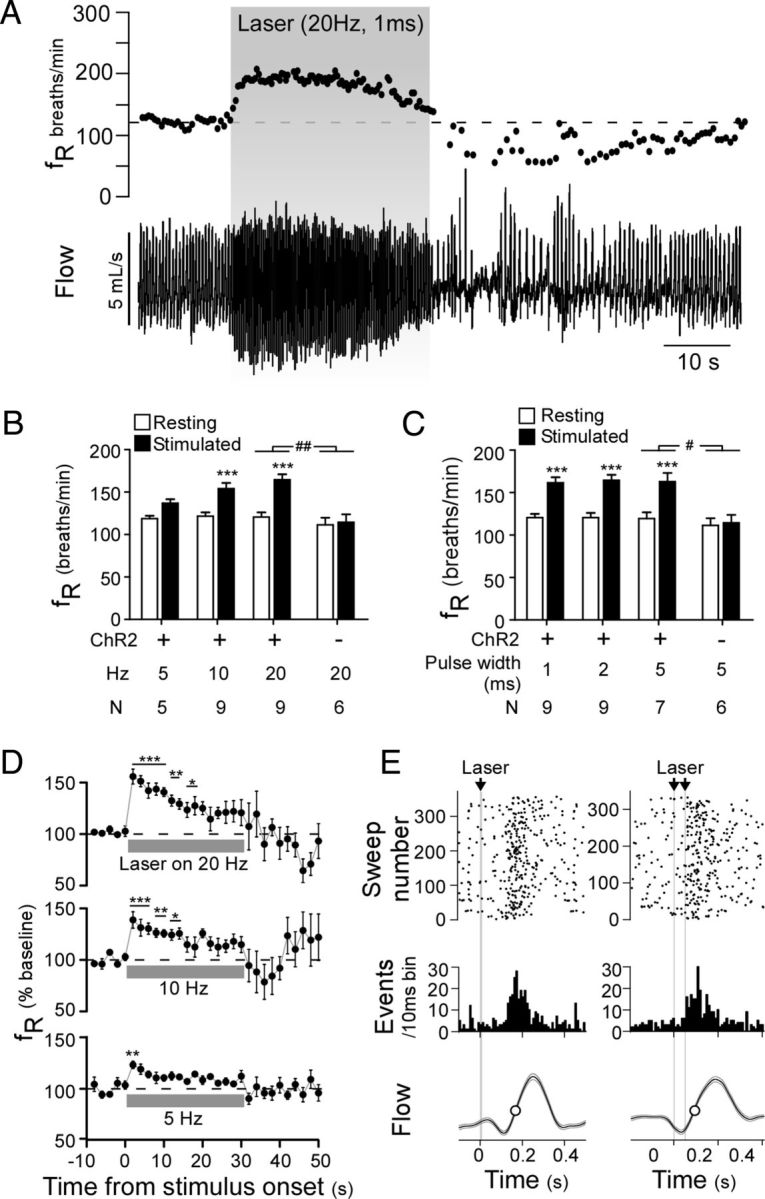
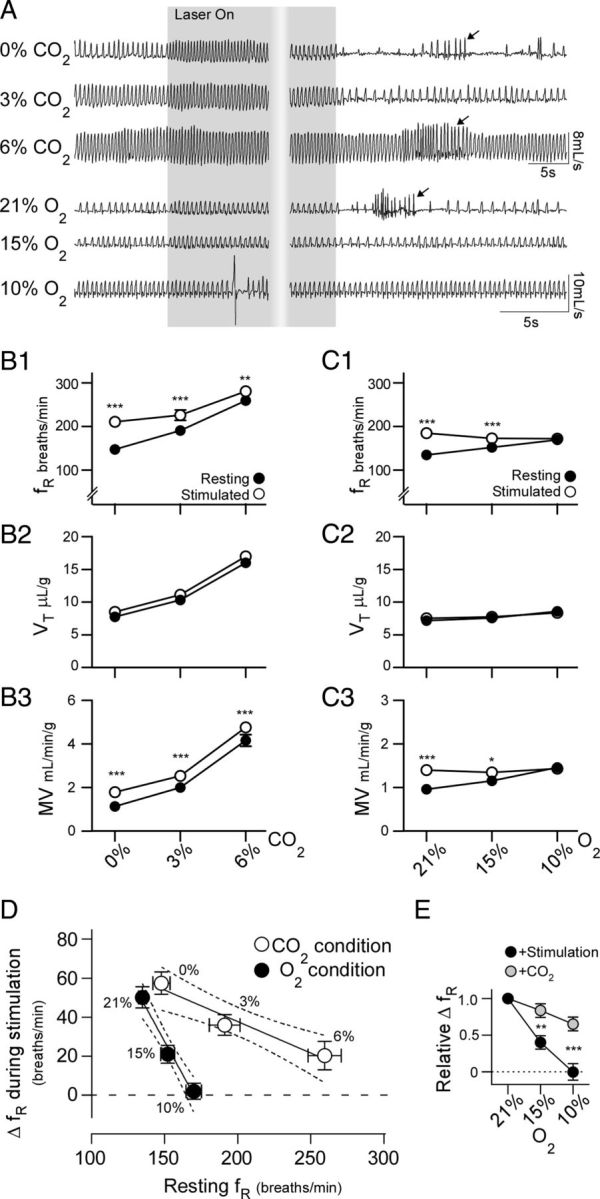
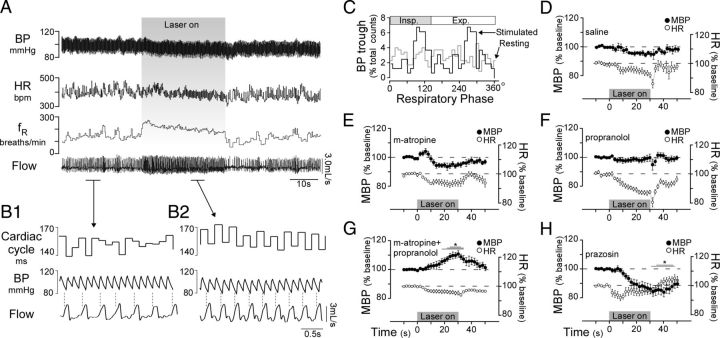
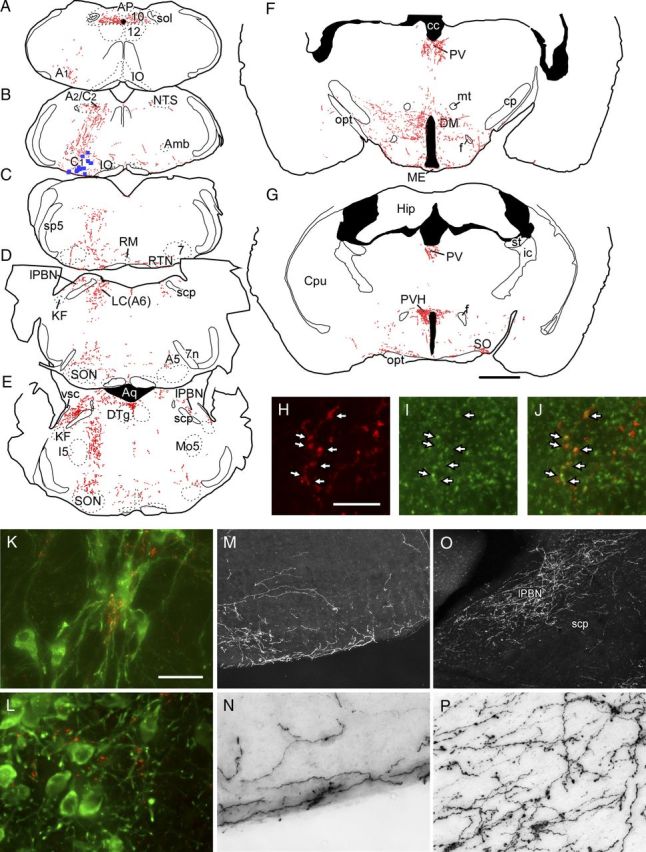
Activation of rostral ventrolateral medullary catecholaminergic (RVLM-CA) neurons e.g., by hypoxia is thought to increase sympathetic outflow thereby raising blood pressure (BP). Here we test whether these neurons also regulate breathing and cardiovascular variables other than BP. Selective expression of ChR2-mCherry by RVLM-CA neurons was achieved by injecting Cre-dependent vector AAV2-EF1α-DIO-ChR2-mCherry unilaterally into the brainstem of dopamine-β-hydroxylase(Cre/0) mice. Photostimulation of RVLM-CA neurons increased breathing in anesthetized and conscious mice. In conscious mice, photostimulation primarily increased breathing frequency and this effect was fully occluded by hypoxia (10% O(2)). In contrast, the effects of photostimulation were largely unaffected by hypercapnia (3 and 6% CO(2)). The associated cardiovascular effects were complex (slight bradycardia and hypotension) and, using selective autonomic blockers, could be explained by coactivation of the sympathetic and cardiovagal outflows. ChR2-positive RVLM-CA neurons expressed VGLUT2 and their projections were mapped. Their complex cardiorespiratory effects are presumably mediated by their extensive projections to supraspinal sites such as the ventrolateral medulla, the dorsal vagal complex, the dorsolateral pons, and selected hypothalamic nuclei (dorsomedial, lateral, and paraventricular nuclei). In sum, selective optogenetic activation of RVLM-CA neurons in conscious mice revealed two important novel functions of these neurons, namely breathing stimulation and cardiovagal outflow control, effects that are attenuated or absent under anesthesia and are presumably mediated by the numerous supraspinal projections of these neurons. The results also suggest that RVLM-CA neurons may underlie some of the acute respiratory response elicited by carotid body stimulation but contribute little to the central respiratory chemoreflex.


Figures

Figure 1.
Figure 1.
Selective expression of ChR2-mCherry in RVLM-CA neurons in DβHCre/0 mice. A, The AAV2 vector was microinjected at the medial edge of the ventral respiratory column (VRC; red dots). These sites were identified electrophysiologically by their anatomical proximity to the facial motor nucleus. B, Example of antidromic field potentials recorded in the facial motor nucleus as the AAV2-containing injection pipette was lowered through the medulla oblongata. C, Multiunit respiratory activity recorded just caudal to the facial motor nucleus, further defining the AAV2 injection sites. D, Transverse hemisection through the left medulla oblongata of a DβHCre/0 mouse that received injections of AAV2-DIO-ef1α-ChR2-mCherry 4 weeks prior into the left RVLM. mCherry (red) and TH (green) are both detected by immunofluorescence. In the C1 region of the RVLM, a majority of the CA neurons expressed the mCherry transgene (yellow/orange). The dorsal group of CA neurons (C2) was not transduced. The lesion was caused by the insertion of the fiber optic, the green color surrounding the lesion is a histological artifact. ION, inferior olivary nucleus; py, pyramidal tract. E, enlargement of the C1 region outlined in D. Scale bars: in D, 100 μm; E, 20 μm.
Figure 2.
Figure 2.
Anatomical distribution of the ChR2-expressing CA neurons and the location of the fiber optic tip. A1–C1, Fiber optic tip placements for the experiments identified above the drawings. Approximate distance from bregma shown in each section (top right). Scale bar: (in A1) A1–C1, 0.5 mm. A2–C2, Grouped rostrocaudal distribution of the RVLM-CA neurons (filled square, neurons ir for both mCherry and TH; open circles, total TH-ir neurons). Cells counted on left (injection) side only. AP with the arrow indicates the rostral tip and caudal extent of the area postrema. FN with the arrow indicates the caudal most location and rostral extension of the facial motor nucleus. Amb, Compact formation of the nucleus ambiguus; IO, inferior olive; pyr, pyramidal tract.
Figure 3.
Figure 3.
Selective activation of RVLM-CA neurons activates breathing in anesthetized DβHCre/0 mice. A, Representative recording of dEMG from an anesthetized mouse (bottom, raw signal; top, rectified and integrated signal, idEMG). B, Breathing activation produced in a representative anesthetized mouse by hypercapnia and stimulation of ChR2-transfected RVLM-CA neurons with laser light (20 Hz, 20 ms long light pulses delivered at the times represented by the gray columns). C1, Grouped data for the effect of hypercapnia (8% CO2), photostimulation of RVLM-CA neurons at 20 Hz with 5 ms or 20 ms light pulses, and photostimulation of the cerebellum (Cb stim) on dEMG amp (N = 7; *p < 0.05). C2, As per C1 for EMG fR (N = 7; *p < 0.05). C3, As per C1 for fR × dEMG amp (N = 7; *p < 0.05).
Figure 4.
Figure 4.
Optogenetic activation of ChR2-expressing RVLM-CA neurons activates breathing in conscious DβHCre/0 mice. A, Plethysmography recording of the respiratory effects of photostimulation in an AAV2-DIO-EF1α-ChR2-mCherry-injected DβHCre/0 mouse (top, respiratory frequency (fR); bottom, respiratory flow signal, upward deflection in waveform represents inspiration). B, C, Relationship between initial change in fR and stimulation frequency at constant light pulse duration (2 ms) (B) and light pulse duration at constant stimulation frequency (20 Hz) (C) in experimental (ChR2-mCherry) and control mice (mCherry alone). ***p < 0.001 for resting versus stimulated in experimental mice by two-way ANOVA with multiple comparisons. #p < 0.05, ##p < 0.01 for the interaction of ChR2-mcherry expression and stimulation in experimental versus control mice. D, Time course of the change in fR during 30 s stimulation trials at 20, 10, and 5 Hz with a 5 ms pulse width (top to bottom traces, respectively) (N = 7). E, Two examples of photostimulus-triggered histograms plotting the onset of inspiration relative to light pulses delivered at low frequency designed to entrain respiratory rhythm. Both the raster plot and binned event counts (10 ms bins) indicate that single (left, 10 ms pulse at 2 Hz) and double (right, 5 ms pulses at 1.83 Hz) light pulses produced a clustering of inspiratory events shortly after the stimulus. Lower trace, Photostimulus-triggered average of respiratory flow during the entrainment protocol.
Figure 5.
Figure 5.
Changes in breathing frequency during stimulation of RVLM-CA neurons is differentially occluded by hypoxia and hypercapnia. A, Initial respiratory effects of photostimulation (5 ms pulse at 20 Hz for 30 s) and poststimulus hypoventilation in a ChR2-mCherry-expressing DβHCre/0 mouse during hyperoxia (100% O2, trace 1), hyperoxic hypercapnia (3 and 6% CO2 balanced in O2, traces 2 and 3, respectively), and a different mouse during normoxia (21% O2 balanced in N2, trace 4) and poikilocapnic hypoxia (15 and 10% O2 balanced in N2, traces 5 and 6). Arrows identify bouts of poststimulus hyperventilation. Note that the period of hypoventilation following the offset of the stimulus under hyperoxic and normoxic conditions is largely abolished when respiratory drive is increased by activating the chemoreceptors. B, Group data of the effects of photostimulation on fR (B1), VT (B2), and MV (B3) under hyperoxic and hyperoxic hypercapnic conditions. N = 9 for each condition, *p < 0.05, **p < 0.01, ***p < 0.001 for resting versus stimulated condition. C, Group data of the effects of photostimulation on fR (C1), VT (C2), and MV (C3) under normoxic and hypoxic conditions. N = 7 for each condition *p < 0.05, **p < 0.01 for resting versus stimulated condition. D, X-Y plot of the average change in fR during stimulation in relation to prestimulus fR under each gas mixture presented in B1 and C1 (p = 0.0001 for difference between slopes, hypercapnia r2 = 0.44, hypoxia r2 = 0.73; error bars indicate 95% CI). E, Change in fR caused by RVLM-CA neuron stimulation and a brief CO2 challenge (15 s of 15% CO2) during graded hypoxia, normalized to the response fR under normoxic conditions. **p < 0.01, ***p < 0.001 for stimulation versus CO2 condition.
Figure 6.
Figure 6.
Selective activation of RVLM-CA neurons increases cardiorespiratory coupling and autonomic activation in conscious DβHCre/0 mice. A, Cardiovascular and respiratory effects of RVLM-CA neuron stimulation (5 ms pulse at 20 Hz). BP, arterial blood pressure; HR, heart rate. B1, B2, Expanded traces of resting (B1) and stimulated (B2) segments in A. During stimulation a marked increase in the synchronicity of the cardiac and respiratory cycles (sinus arrhythmia) is manifested by increased beat-to-beat variability. Broken vertical lines mark onset of inspiration and highlight sinus arrhythmia. C, Phase histogram plot of occurrence of BP nadirs (representing cardiac contraction) relative to the respiratory cycle (triggered from the rising phase of inspiration) plotted from A. Note that while the respiratory cycle was shortened by stimulation, the phase duration of inspiration was unchanged (resting, 0–130°; stimulated, 0–137°). D–H, Effects of photostimulation (5 ms, 20 Hz, 30 s) on MBP and HR after intraperitoneal injection of saline (D), methyl-atropine (E), propranolol (F), methyl-atropine plus propranolol (G), and prazosin (H). (*Overlapping lines reflect significant differences: one line, p < 0.05; two lines p < 0.01; three lines p < 0.001 by Dunnett's post test between drug and saline treatment.)
Figure 7.
Figure 7.
Glutamatergic projections of RVLM-CA neurons in DβHCre/0 mice. A–G, Computer-assisted drawings of representative transverse brain sections from a DβHCre/0 mouse in which RVLM-CA neurons expressed ChR2-mCherry. B, At the level of the injection site, each blue square represents a single mCherry-expressing TH-ir neuron. Each red dot represents a putative synaptic terminal ir for both VGLUT2 and mCherry. The AAV2 vector was injected on the left and all drawings retain this orientation. Estimated distance in millimeters caudal to bregma in A, 7.76; B, 6.72; C, 6.36; D, 5.34; E, 5.20; F, 1.94; G, 0.82. H–J, Coronal section of the thoracic spinal cord showing mCherry-ir terminals (H) and VGlut2-ir terminals (I) (merged image in J) in the intermediolateral cell column. Arrows show coincidence of these markers, indicating that the mCherry-expressing RVLM-CA neurons are glutamatergic. K, L, mCherry-ir fibers and terminals (Cy3, red) making close appositions with TH-ir (Alexa 488, green) A1neurons (K) and locus ceruleus neurons (L). M, N, mCherry immunoreactivity visualized with DAB chromagen on the ventral surface of the RVLM on the side contralateral to the injection site. M, Dark field (low power) and N, bright field (high power). O–P, mCherry immunoreactivity in the lateral parabrachial nucleus visualized with DAB chromagen (side ipsilateral to the injection). O, Dark field (low power) and P, bright field (high power). Scale bars: (in G) A–G, 1 mm; (in H) H–J, 10 μm; (in K) K, L, N, P, 30 μm, M, O, 190 μm. 7, Facial motor nucleus; 7n, facial nerve; 10, dorsal motor nucleus of the vagus; 12, hypoglossal nucleus; A1, A1 noradrenergic cell cluster; A2/C2, dorsal medullary noradrenergic and adrenergic cell clusters; A5, A5 pontine noradrenergic cell cluster; Aq, aqueduct of Sylvius; cc, corpus callosum; cp, cerebellar peduncle, basal part; CPu, caudate–putamen; DM, dorsomedial hypothalamic nucleus; DTg, dorsal tegmental nucleus; f, fornix; Hip, hippocampus; I5, intertrigeminal nucleus; ic, internal capsule; KF, Kölliker–Fuse nucleus; LC, locus coeruleus; lPBN, lateral parabrachial nucleus; ME, median eminence; Mo5, motor trigeminal nucleus; mt, mammillothalamic tract; opt, optic tract; PV, paraventricular thalamic nucleus; PVH, paraventricular hypothalamic nucleus; RM, raphe magnus; scp, superior cerebellar peduncle; sp5, spinal trigeminal tract; SO, supraoptic nucleus; SON, superior olive; sol, solitary tract; st, stria terminalis; vsc, ventral spinocerebellar tract.

References

    1. Abbott SB, Stornetta RL, Fortuna MG, Depuy SD, West GH, Harris TE, Guyenet PG. Photostimulation of retrotrapezoid nucleus phox2b-expressing neurons in vivo produces long-lasting activation of breathing in rats. J Neurosci. 2009a;29:5806–5819. - PMC - PubMed
    1. Abbott SB, Stornetta RL, Socolovsky CS, West GH, Guyenet PG. Photostimulation of channelrhodopsin-2 expressing ventrolateral medullary neurons increases sympathetic nerve activity and blood pressure in rats. J Physiol. 2009b;587:5613–5631. - PMC - PubMed
    1. Abbott SB, Stornetta RL, Coates MB, Guyenet PG. Phox2b-expressing neurons of the parafacial region regulate breathing rate, inspiration, and expiration in conscious rats. J Neurosci. 2011;31:16410–16422. - PMC - PubMed
    1. Aicher SA, Saravay RH, Cravo S, Jeske I, Morrison SF, Reis DJ, Milner TA. Monosynaptic projections from the nucleus tractus solitarii to C1 adrenergic neurons in the rostral ventrolateral medulla: comparison with input from the caudal ventrolateral medulla. J Comp Neurol. 1996;373:62–75. - PubMed
    1. Arango V, Ruggiero DA, Callaway JL, Anwar M, Mann JJ, Reis DJ. Catecholaminergic neurons in the ventrolateral medulla and nucleus of the solitary tract in the human. J Comp Neurol. 1988;273:224–240. - PubMed

Publication types

MeSH terms

LinkOut - more resources