

Impairment of BRCA1-related DNA double-strand break repair leads to ovarian aging in mice and humans
- PMID: 23408054
- PMCID: PMC5130338
- DOI: 10.1126/scitranslmed.3004925
Impairment of BRCA1-related DNA double-strand break repair leads to ovarian aging in mice and humans
Abstract
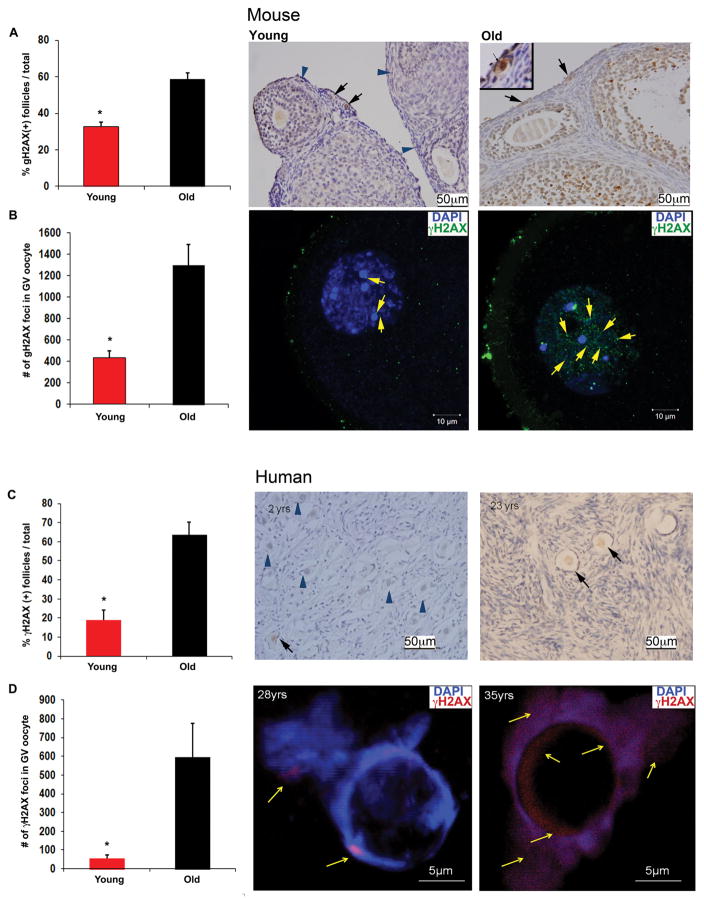
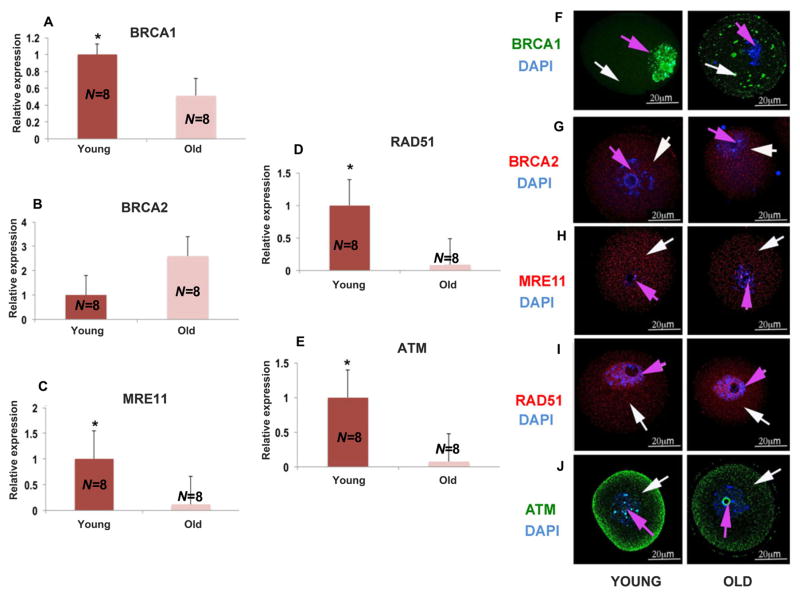
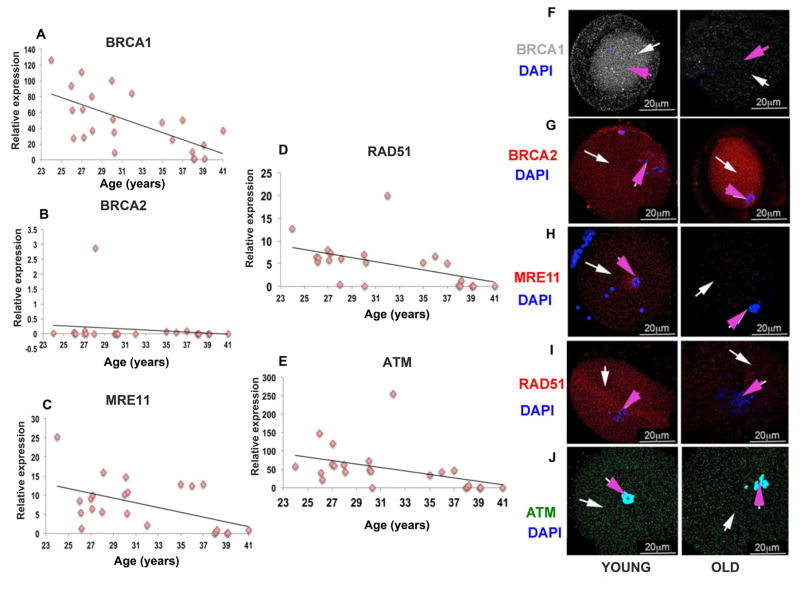
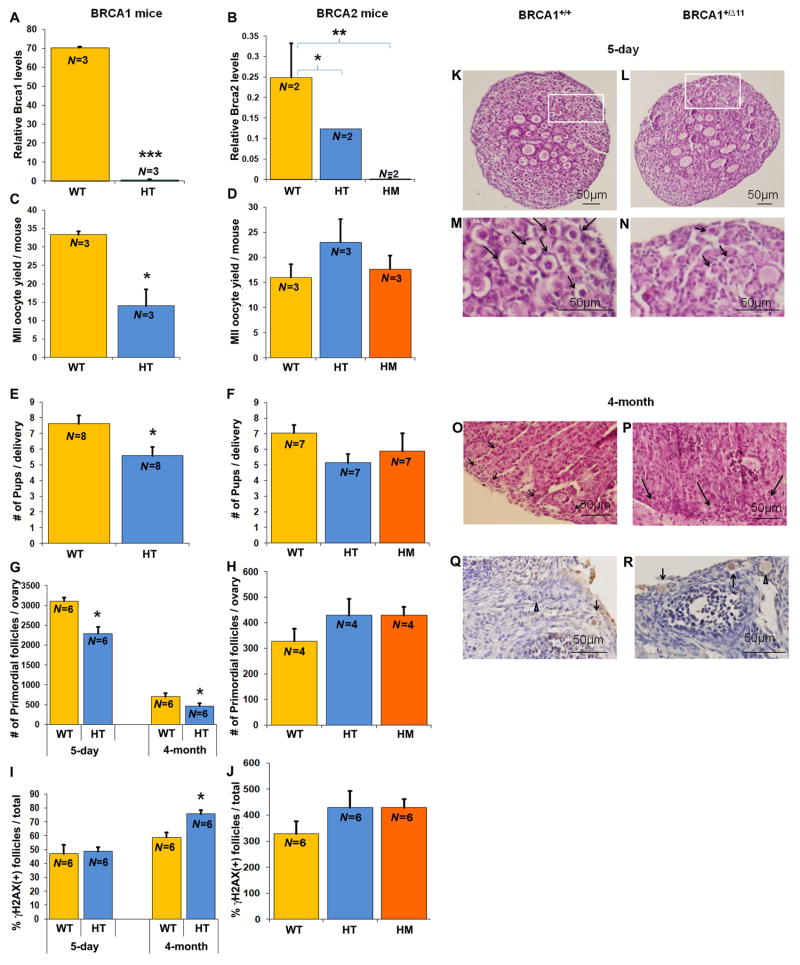
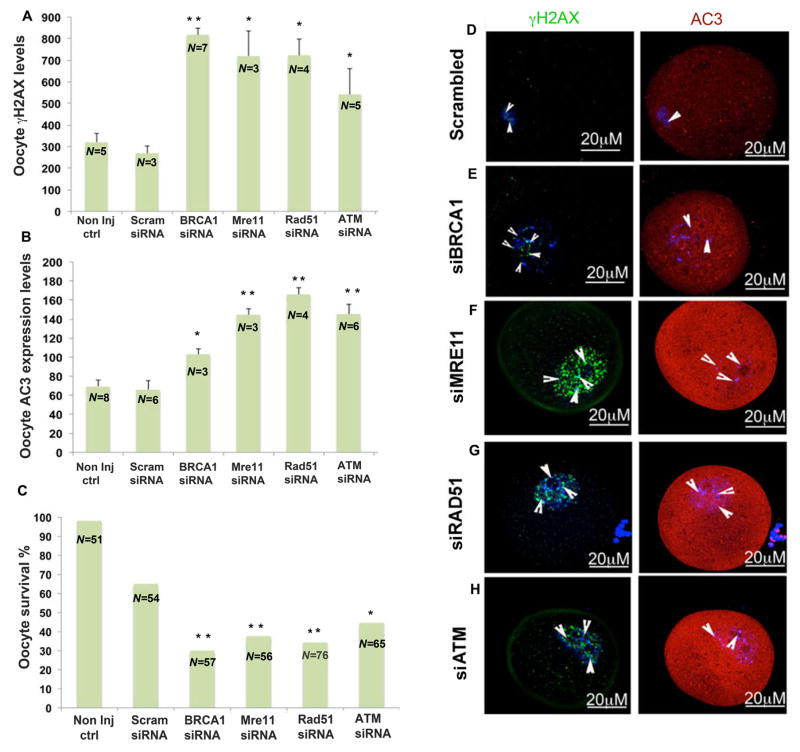
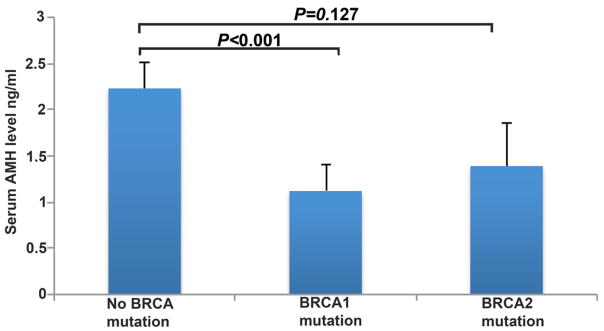
The underlying mechanism behind age-induced wastage of the human ovarian follicle reserve is unknown. We identify impaired ATM (ataxia-telangiectasia mutated)-mediated DNA double-strand break (DSB) repair as a cause of aging in mouse and human oocytes. We show that DSBs accumulate in primordial follicles with age. In parallel, expression of key DNA DSB repair genes BRCA1, MRE11, Rad51, and ATM, but not BRCA2, declines in single mouse and human oocytes. In Brca1-deficient mice, reproductive capacity was impaired, primordial follicle counts were lower, and DSBs were increased in remaining follicles with age relative to wild-type mice. Furthermore, oocyte-specific knockdown of Brca1, MRE11, Rad51, and ATM expression increased DSBs and reduced survival, whereas Brca1 overexpression enhanced both parameters. Likewise, ovarian reserve was impaired in young women with germline BRCA1 mutations compared to controls as determined by serum concentrations of anti-Müllerian hormone. These data implicate DNA DSB repair efficiency as an important determinant of oocyte aging in women.
Conflict of interest statement
The authors declare that they have no competing interests.
Figures
Comment in
-
Ovarian aging: breaking up is hard to fix.Sci Transl Med. 2013 Feb 13;5(172):172fs5. doi: 10.1126/scitranslmed.3005579. Sci Transl Med. 2013. PMID: 23408052
Similar articles
-
BRCA-related ATM-mediated DNA double-strand break repair and ovarian aging.Hum Reprod Update. 2020 Jan 1;26(1):43-57. doi: 10.1093/humupd/dmz043. Hum Reprod Update. 2020. PMID: 31822904 Free PMC article. Review.
-
The DNA double-strand break repair proteins γH2AX, RAD51, BRCA1, RPA70, KU80, and XRCC4 exhibit follicle-specific expression differences in the postnatal mouse ovaries from early to older ages.J Assist Reprod Genet. 2024 Sep;41(9):2419-2439. doi: 10.1007/s10815-024-03189-4. Epub 2024 Jul 18. J Assist Reprod Genet. 2024. PMID: 39023827 Free PMC article.
-
Increased chemotherapy-induced ovarian reserve loss in women with germline BRCA mutations due to oocyte deoxyribonucleic acid double strand break repair deficiency.Fertil Steril. 2020 Jun;113(6):1251-1260.e1. doi: 10.1016/j.fertnstert.2020.01.033. Epub 2020 Apr 22. Fertil Steril. 2020. PMID: 32331767 Free PMC article.
-
Ovarian Aging in Women With BRCA Germline Mutations.J Clin Endocrinol Metab. 2017 Oct 1;102(10):3839-3847. doi: 10.1210/jc.2017-00765. J Clin Endocrinol Metab. 2017. PMID: 28938488 Free PMC article.
-
Human syndromes with genomic instability and multiprotein machines that repair DNA double-strand breaks.Histol Histopathol. 2003 Jan;18(1):225-43. doi: 10.14670/HH-18.225. Histol Histopathol. 2003. PMID: 12507302 Review.
Cited by
-
Pharmacogenomic studies of fertility outcomes in pediatric cancer survivors - A systematic review.Clin Transl Sci. 2024 Jun;17(6):e13827. doi: 10.1111/cts.13827. Clin Transl Sci. 2024. PMID: 38924306 Free PMC article.
-
Recent Advancements in In Vitro Fertilisation.Cureus. 2022 Oct 10;14(10):e30116. doi: 10.7759/cureus.30116. eCollection 2022 Oct. Cureus. 2022. PMID: 36381837 Free PMC article. Review.
-
Primary ovarian insufficiency: update on clinical and genetic findings.Front Endocrinol (Lausanne). 2024 Sep 26;15:1464803. doi: 10.3389/fendo.2024.1464803. eCollection 2024. Front Endocrinol (Lausanne). 2024. PMID: 39391877 Free PMC article. Review.
-
DNA damage control then and now: a matter of life or death.J Assist Reprod Genet. 2020 Jul;37(7):1509-1510. doi: 10.1007/s10815-020-01889-1. J Assist Reprod Genet. 2020. PMID: 32671733 Free PMC article. No abstract available.
-
Association Between Impairment of DNA Double Strand Break Repair and Decreased Ovarian Reserve in Patients With Endometriosis.Front Endocrinol (Lausanne). 2018 Dec 21;9:772. doi: 10.3389/fendo.2018.00772. eCollection 2018. Front Endocrinol (Lausanne). 2018. PMID: 30622513 Free PMC article.
References
-
- Oktay K, Briggs D, Gosden RG. Ontogeny of follicle-stimulating hormone receptor gene expression in isolated human ovarian follicles. J Clin Endocrinol Metab. 1997;82:3748–3751. - PubMed
-
- Faddy MJ, Gosden RG, Gougeon A, Richardson SJ, Nelson JF. Accelerated disappearance of ovarian follicles in mid-life: Implications for forecasting menopause. Hum Reprod. 1992;7:1342–1346. - PubMed
-
- Younis JS. Ovarian aging: latest thoughts on assessment and management. Curr Opin Obstet Gynecol. 2011;23:427–434. - PubMed
-
- Hansen KR, Knowlton NS, Thyer AC, Charleston JS, Soules MR, Klein NA. A new model of reproductive aging: the decline in ovarian non-growing follicle number from birth to menopause. Hum Reprod. 2008;23:699–708. - PubMed
-
- Jazayeri A, Falck J, Lukas C, Bartek J, Smith GC, Lukas J, Jackson SP. ATM- and cell cycle-dependent regulation of ATR in response to DNA double-strand breaks. Nat Cell Biol. 2006;8:37–45. - PubMed
Publication types
MeSH terms
Substances
Grants and funding
LinkOut - more resources
Full Text Sources
Other Literature Sources
Medical
Molecular Biology Databases
Research Materials
Miscellaneous
