

A spectroscopic and computational study of Al(III) complexes in cryolite melts: Effect of cation nature
- PMID: 23408115
- PMCID: PMC3568921
- DOI: 10.1016/j.chemphys.2012.11.006
A spectroscopic and computational study of Al(III) complexes in cryolite melts: Effect of cation nature
Abstract
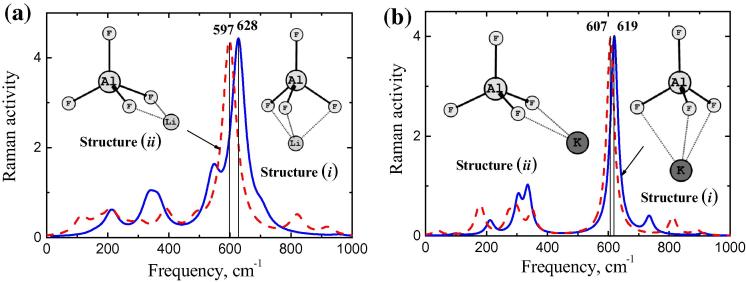
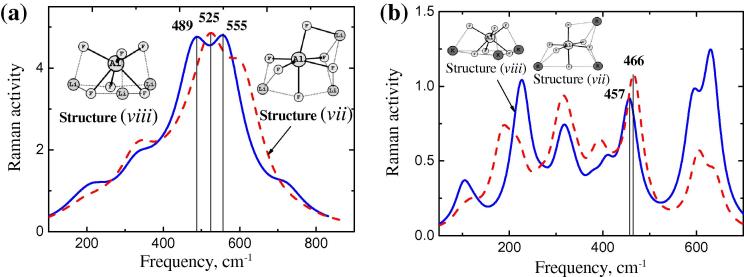
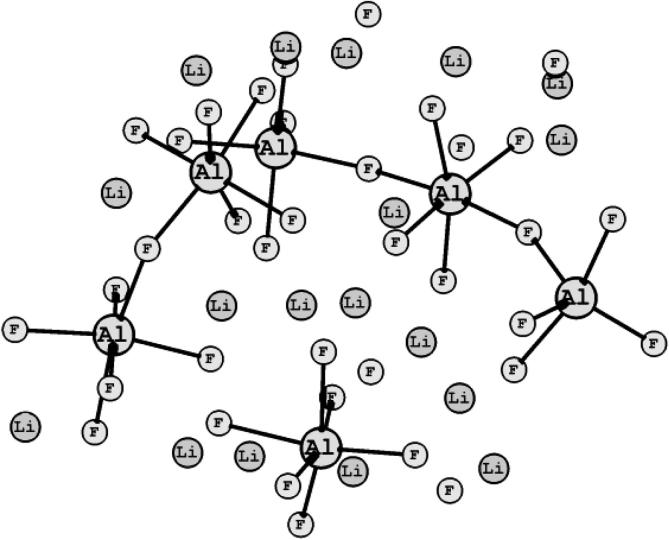
Lithium, sodium and potassium cryolite melts are probed by Raman spectroscopy in a wide range of the melt composition. The experimental data demonstrate a slight red shift of main peaks and a decrease of their half-widths in the row Li(+), Na(+), K(+). Quantum chemical modelling of the systems is performed at the density functional theory level. The ionic environment is found to play a crucial role in the energy of fluoroaluminates. Potential energy surfaces describing the formation/dissociation of certain complex species, as well as model Raman spectra are constructed and compared with those obtained recently for sodium containing cryolite melts (R.R. Nazmutdinov, et al., Spectrochim, Acta A 75 (2010) 1244.). The calculations show that the cation nature affects the geometry of the ionic associates as well as the equilibrium and kinetics of the complexation processes. This enables to interpret both original experimental data and those reported in literature.
Keywords: Alkali cation nature; Cryolite melts; Density functional theory; Fluoraluminates; Quantum chemical modelling; Raman spectroscopy.
Figures


References
-
- Thonstad J., Feller P., Haarberg G.M., Hiveš J., Kvande H., Sterten Å. third ed. Aluminium-Verlag; Dusseldorf: 2001. Aluminium Electrolysis. Fundamentals of the Hall–Héroult Process.
-
- Yang J., Hryn J.N., Davis B.R., Roy A., Krumdick G.K., Pomykala J.A. TMS Light Met. 2004:321.
-
- Gilbert B., Robert E., Tixhon E., Olsen J., Øsvold T. Inorg. Chem. 1996;35:4198. - PubMed
-
- Brooker M.H., Berg R.W., von Barner J.H., Bjerrum N.J. Inorg. Chem. 2000;39:3682. - PubMed
-
- von Barner J.H., Bessada C., Berg R.W. Inorg. Chem. 2003;42:1901. - PubMed
LinkOut - more resources
Full Text Sources
Other Literature Sources
