. 2013 Feb 12:7:4.
doi: 10.3389/fnbeh.2013.00004. eCollection 2013.

Processing of visual signals related to self-motion in the cerebellum of pigeons

Affiliations

Processing of visual signals related to self-motion in the cerebellum of pigeons

Douglas R Wylie. Front Behav Neurosci. .

Abstract

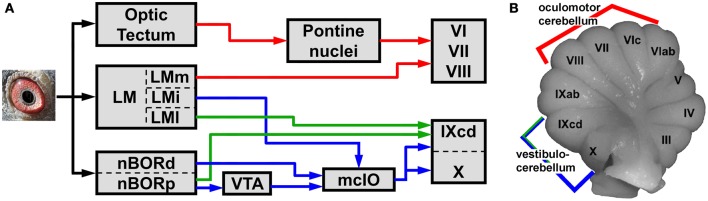
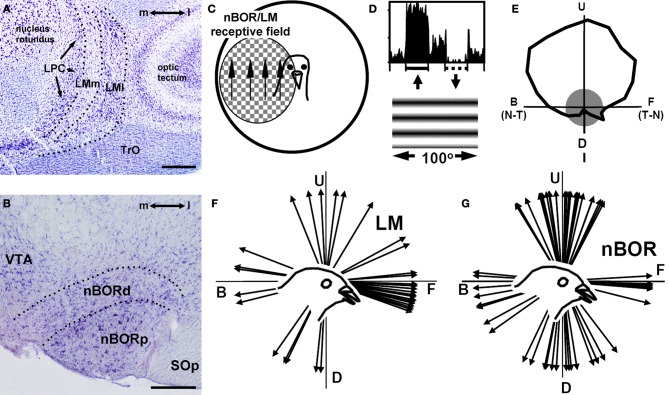
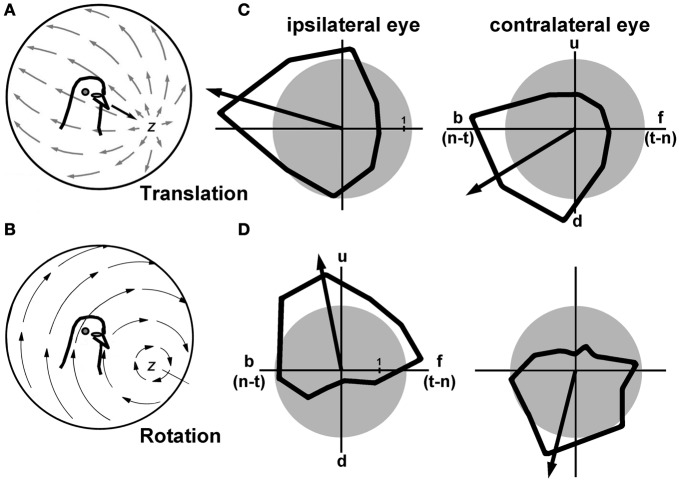
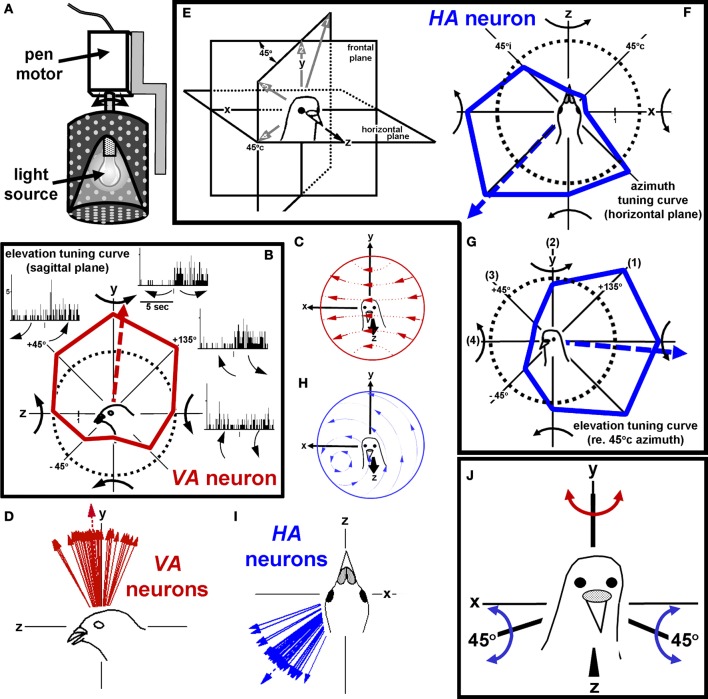
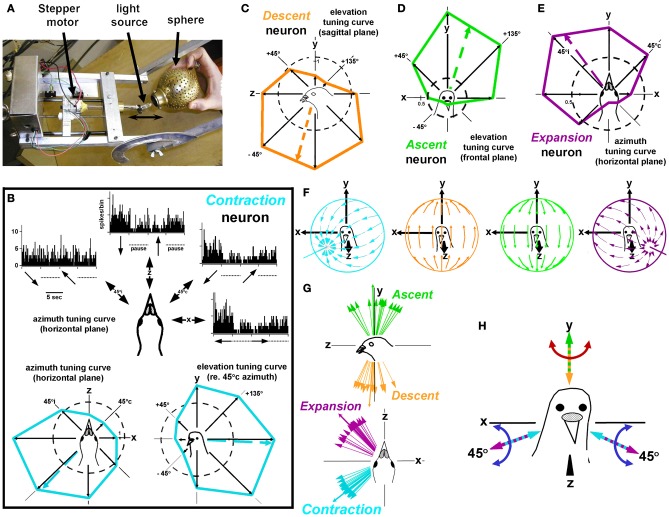
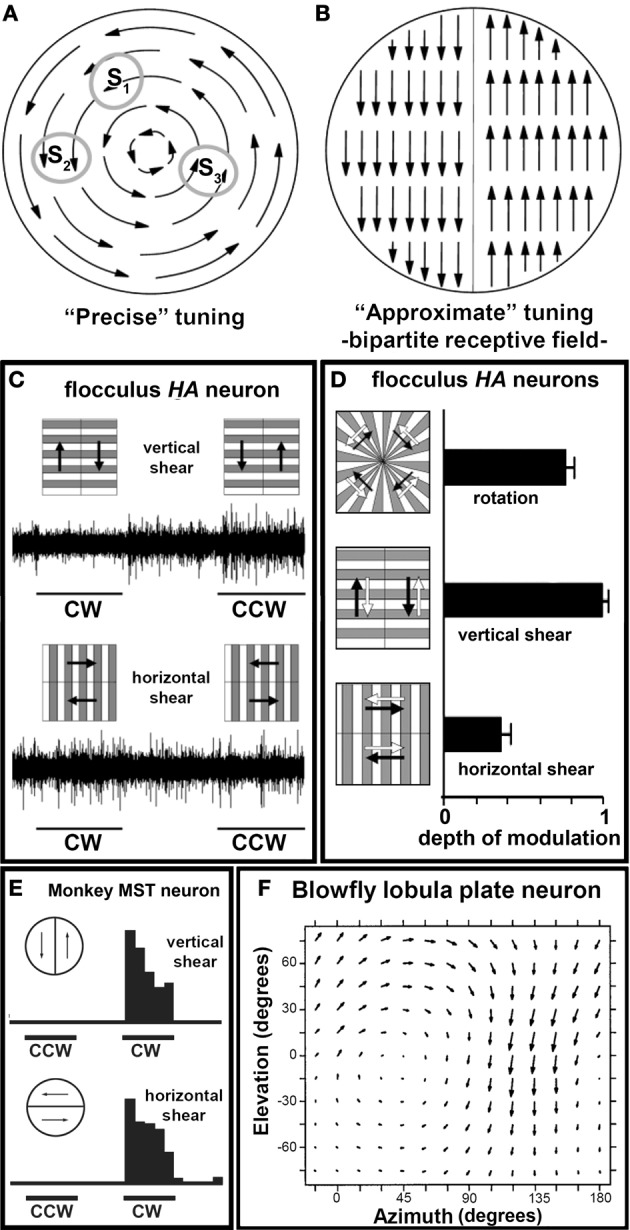
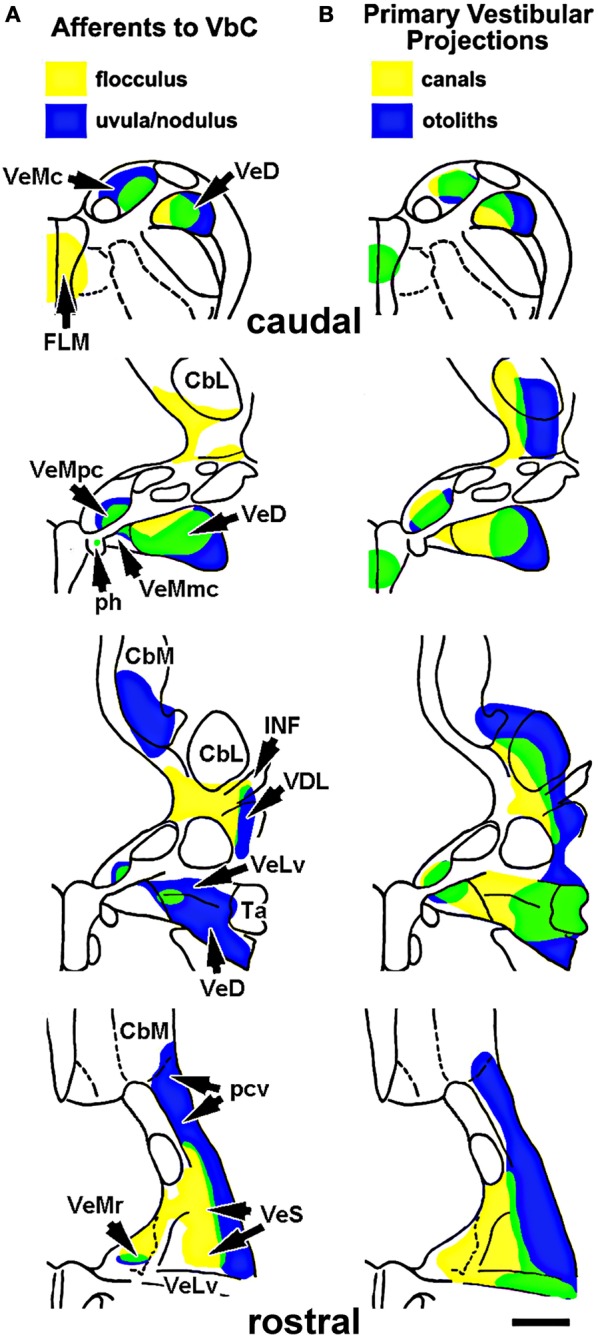
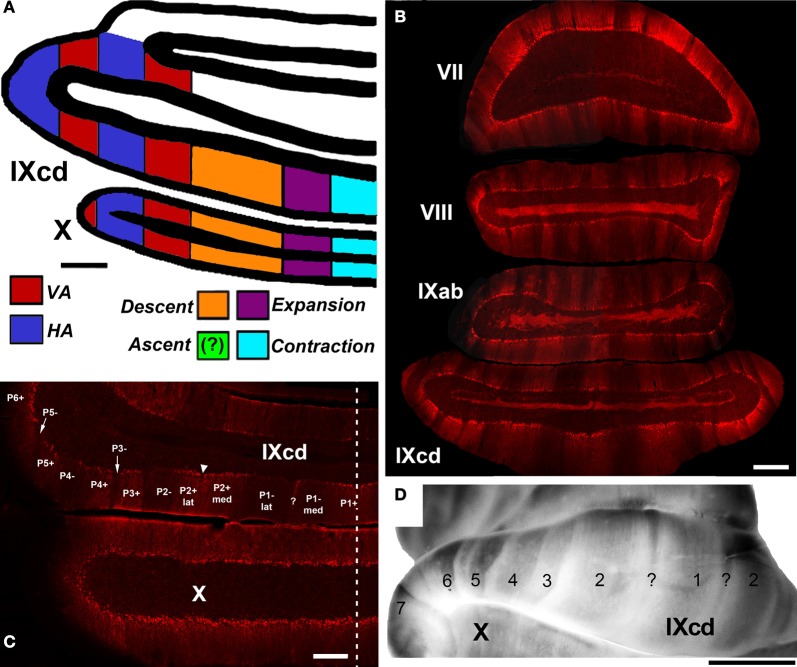
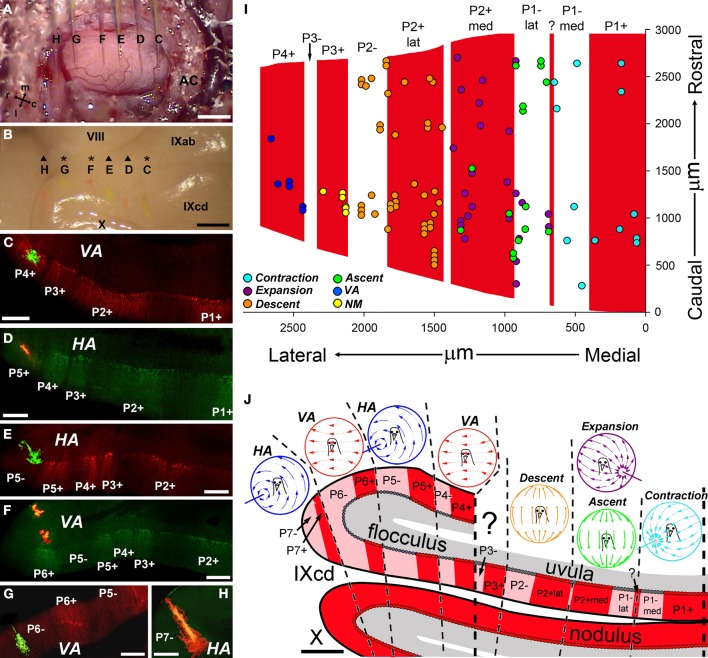
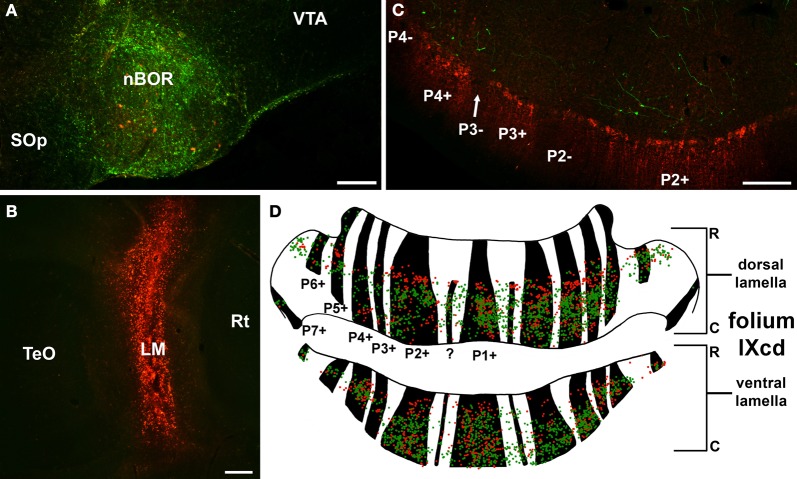
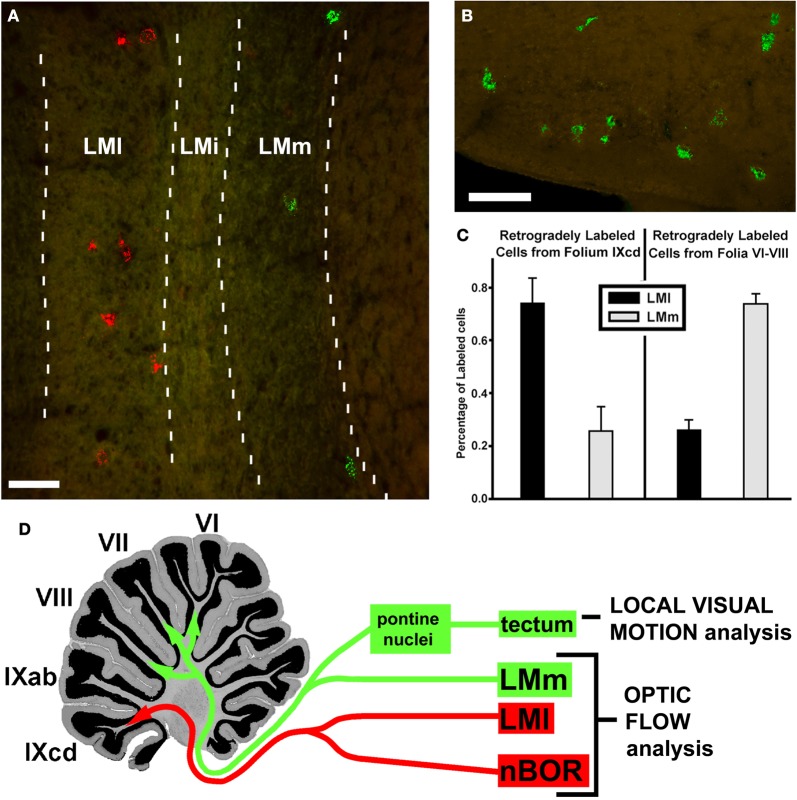
In this paper I describe the key features of optic flow processing in pigeons. Optic flow is the visual motion that occurs across the entire retina as a result of self-motion and is processed by subcortical visual pathways that project to the cerebellum. These pathways originate in two retinal-recipient nuclei, the nucleus of the basal optic root (nBOR) and the nucleus lentiformis mesencephali, which project to the vestibulocerebellum (VbC) (folia IXcd and X), directly as mossy fibers, and indirectly as climbing fibers from the inferior olive. Optic flow information is integrated with vestibular input in the VbC. There is a clear separation of function in the VbC: Purkinje cells in the flocculus process optic flow resulting from self-rotation, whereas Purkinje cells in the uvula/nodulus process optic flow resulting from self-translation. Furthermore, Purkinje cells with particular optic flow preferences are organized topographically into parasagittal "zones." These zones are correlated with expression of the isoenzyme aldolase C, also known as zebrin II (ZII). ZII expression is heterogeneous such that there are parasagittal stripes of Purkinje cells that have high expression (ZII+) alternating with stripes of Purkinje cells with low expression (ZII-). A functional zone spans a ZII± stripe pair. That is, each zone that contains Purkinje cells responsive to a particular pattern of optic flow is subdivided into a strip containing ZII+ Purkinje cells and a strip containing ZII- Purkinje cells. Additionally, there is optic flow input to folia VI-VIII of the cerebellum from lentiformis mesencephali. These folia also receive visual input from the tectofugal system via pontine nuclei. As the tectofugal system is involved in the analysis of local motion, there is integration of optic flow and local motion information in VI-VIII. This part of the cerebellum may be important for moving through a cluttered environment.

Keywords: accessory optic system; cerebellum; oculomotor cerebellum; optic flow; pretectum; vestibulocerebellum; zebrin.


Figures

Figure 1
Figure 1
A reduced schematic, showing the visual pathways (A) to the cerebellum (B) in birds. The cerebellum is divided into folia, numbered I–X from anterior to posterior (Larsell, 1967). Folia IXcd and X comprise the vestibulocerebellum, which receives optic flow input from the nucleus of the basal optic root (nBOR) and lentiformis mesencephali (LM) via a climbing fiber pathway through the medial column of the inferior olive (mcIO) (blue pathway) (Arends and Voogd, ; Lau et al., 1998). The LM and nBOR also project directly to folium IXcd as mossy fibers (green pathways) (Brauth and Karten, ; Clarke, ; Brecha et al., ; Wylie and Linkenhoker, 1996). The LM also projects to folia VI–VIII (red pathway), which are part of the oculomotor cerebellum (Voogd and Barmack, 2006). These folia also receive visual motion signals from a tecto-pontine system (red pathway) (Reiner and Karten, 1982). See text for additional details. LMm, i, l: the medial, intercalatus, and lateral divisions of LM. nBORd, p: the dorsalis and proper divisions of nBOR. VTA: ventral tegmental area.
Figure 2
Figure 2
Basic visual processing in the accessory optic system in birds. (A) and (B), Respectively, show Nissl-stained coronal sections through the pigeon lentiformis mesenceophali (LM) and nucleus of the basal optic root (nBOR). (C) Indicates that most nBOR and LM neurons have large receptive fields in the contralateral visual field and exhibit directional tuning in response to largefield motion (e.g., Burns and Wallman, ; Winterson and Brauth, 1985). (D) Shows the response of a nBOR neuron to upward (excitation) and downward (inhibition) motion of a large drifting sine-wave grating (from Crowder and Wylie, 2001). (E) Shows a directional tuning curve of a typical nBOR neuron. Firing rate (spikes/s) is plotted as a function of the direction of motion in polar coordinates, and the gray circle represents the neuron's spontaneous firing rate. The directions are indicated as follows: U, upward; D, downward; F, forward or temporal-to-nasal (T-N), and B, backward or nasal-to-temporal (N-T). (F) Shows a distribution of the direction preferences of LM neurons in pigeons: most prefer forward motion (adapted from Wylie and Crowder, 2000). (G) Shows a distribution of the direction preferences of nBOR neurons in pigeons: most prefer upward, downward, or backward motion (Crowder et al., 2003).
Figure 3
Figure 3
(A) Shows the pattern of optic flow resulting from forward translation along the z-axis, as projected onto a sphere surrounding the bird. The arrows represent local image motion in the flowfield. (B) Shows the optic flow resulting from rotation about the z-axis (roll). (C) and (D) Show the directional tuning curves in response to large-field stimulation of the ipsi- and contralateral eyes for Purkinje cells in the vestibulocerebellum. The arrows represent the peak best fit sine wave to the tuning curve, and serves as a proxy for the preferred direction. The cell in (C) preferred backward (b) [i.e., nasal-to-temporal (n-t)] motion in both eyes, which would result from forward self-translation (adapted from Graham and Wylie, 2012). The cell in (D) preferred upward (u) motion in the ipsilateral eye, and downward motion in the contralateral eye, which results from rotation of the head about the z-axis (roll) (adapted from Wylie and Frost, 1991). The gray circles represent the spontaneous firing rates of these neurons, which is typically about 1 spikes/s. d: downward motion; f: forward motion [i.e., temporal-to-nasal (t-n)].
Figure 4
Figure 4
Stimulating rotation-sensitive optic flow neurons in the pigeon vestibulocerebellum (VbC). (A) Shows a schematic of the planetarium projector used to simulate rotational optic flow. (B) Shows the elevation tuning curve for a vertical axis (VA) neuron. The flowfield that maximally stimulates VA neurons shown in (C), and the best axes of several VA neurons are shown in (D). (E–G) Shows axis tuning for an HA neuron. (F) Shows an azimuth tuning curve plotting the responses to rotation about axes in the horizontal (xz) plane. (G) Shows an azimuth tuning curve in a vertical plane that intersects the horizontal plane through 45° contralateral azimuth (45°c). The flowfield that maximally stimulates HA neurons in shown in (H), and the best axes of several HA neurons are shown in (I). (J) Shows the reference frame for rotational optic flow responses in the VbC. Considering both sides of the brain, it consists of three orthogonal axes: the vertical (y) axis and two horizontal axes oriented 45° to the midline. All responses in this and subsequent figures refer to recording from neurons in the VbC on the left side of the brain. These data are from Wylie and Frost (1993). See text for additional details.
Figure 5
Figure 5
Stimulating translation-sensitive optic flow neurons in the pigeon vestibulocerebellum (VbC). (A) Shows a schematic of the translator projector used to simulate translational optic flow. This was suspended above the bird's head in gimbals such that the axis of translation could be oriented anywhere in 3-dimensional space. (B) Shows the responses of a Contraction neuron. An azimuth tuning curve (xz plane) is shown as well as an elevation tuning curve in a vertical plane that intersects the horizontal plane at 45°c azimuth. (C–E) Show tuning curves for the other three types of translation neurons in the VbC: Descent, Ascent and Expansion. The flowfields that maximally stimulate each of the four types are shown in (F), and the best axes of translation for the four groups are shown in (G). (H) Shows the common reference frame for translational and rotational optic flow reponses in the VbC. The data are from Wylie and Frost (1999b). See text for additional details.
Figure 6
Figure 6
(A) and (B), Respectively, show receptive fields either “precisely” tuned for rotational optic flow by pooling many local motion detectors with different direction preferences, or “approximately” tuned with a bipartite receptive field structure. (C) Shows the responses of an HA neuron to composite stimuli. The neuron responded much better to vertical shear as opposed to horizontal shear, indicating that it has a bipartite receptive field structure shown in (B) (Winship and Wylie, 2006). (D) Shows the normalized depth of modulation [(CCW−CW)/(CCW+CW)] for all rotation units (n = 22) in response to the three stimulus configurations illustrated (mean ± s.e.m). Note that the cells responded better to the vertical shear as opposed to the true rotation (Winship and Wylie, 2006). (E) Shows the responses of a rotation sensitive neuron in monkey area MST to similar stimuli. It responded equally well to vertical and horizontal shear, indicating that it has a precisely tuned receptive field (from Tanaka and Saito, 1989). (F) Shows the responses of an optic flow neuron in the lobula plate in blowflies to local stimulation. These neurons have an underlying receptive field with precise tuning (from Krapp et al., 1998).
Figure 7
Figure 7
(A) Shows the areas of the vestibular nuclei that project to the flocculus (yellow) and uvula-nodulus (blue). Green represents areas of overlap, which contains cells that project to the flocculus and the uvula/nodulus (based on Pakan et al., 2008). (B) Shows the areas of the vestibular nuclei that receive input from the otolith organs (blue) and semicircular canals (yellow). The areas in green receive input from both the semicircular canals and otolith organs (based on Schwarz and Schwarz, and Dickman and Fang, 1996). Abbreviations: VeMc, r, pc, mc: the caudal, rostral, parvocellular, and magnocellular divisions of the medial vestibular nucleus; VeD: descending vestibular nucleus; FLM: medial longitudinal fasciculus; ph: prepositus hypoglossi; CbM: medial cerebellar nucleus; CbL: lateral cerebellar nucleus; INF: infracerebellar nucleus; VDL: dorsolateral vestibular nucleus; VeLv: lateral vestibular nucleus, ventral division; Ta: tangential nucleus; pcv: cerebellovestibular process. Scale bar = 1 mm.
Figure 8
Figure 8
(A) Shows a schematic of the zonal organization of the optic flow responsive cells in the VbC as concluded from a series of electrophysiological and anatomical studies (Wylie and Frost, , ; Wylie et al., , ,; Winship and Wylie, ; Pakan et al., 2005). The location of the Ascent units was unknown. (B) Shows a coronal section through the posterior cerebellum (folia VII–IXcd) showing heterogeneous zebrin II (ZII) expression. (C) and (D) Highlight the ZII expression in the vestibulocerebellum. (D) Is a wholemount of the cerebellum whereas (C) is a coronal section through folia IXcd and X. The ZII stripes are numbered P1± to P7± from the midline (indicated by the dashed line). P6−, P7+, and P7− are found more rostrally, as seen in (D). P1− is divided into medial and lateral portions by a small satellite immunopositive band one to two Purkinje cells wide in the middle of P1− denoted “?”. P2+ is divided into medial and lateral portions by a small immunonegative “notch” in the middle of P2+ (see inverted triangle). Folium X does not have ZII stripes, as all Purkinje cells are ZII+ve. (B) and (D) Are adapted from Pakan et al. (2007). (C) Is adapted from Graham and Wylie (2012). Scale bars: (A,B) = 500 μm; (C) = 300 μm; (D) = 2.5 mm.
Figure 9
Figure 9
Relationship between the optic flow zones and the zebrin II (ZII) stripes in the pigeon vestibulocerebellum (VbC). (A–H) Show results from a single experiment. (A) Shows the surface of the exposed flocculus. This is the superimposition of six photos, such that the locations of six injection electrodes (C–H) filled with either red biotinylated dextran amine (BDA) (D,F,H) or green BDA (C,E,G) are shown. (B) Shows the subsequently perfused and dissected brain. Traces of the six injections can clearly be seen on the surface of IXcd. (C–H) Show coronal sections through the VbC that have been immunoreacted for ZII to illustrate the locations of all the injections in particular ZII stripes (from Pakan et al., 2011). (I) Shows our efforts to determine the locations of the translational optic flow zones relative to the ZII stripes in IXcd (Graham and Wylie, 2012). Collapsed from several recording experiments, the recording sites of Contraction (light blue), Expansion (purple), Ascent (green), and Descent (orange) cells are indicated, as well as some cells not modulated to visual stimuli (NM; yellow) and a few VA cells (dark blue). (J) Shows a summary of how the rotational and translational optic flow neurons are organized with respect to the ZII stripes. See text for additional details. ?: Small immunopositive satellite band one to two Purkinje cells wide in the middle of P1−; AC: anterior canal; m, l, r, and c: medial, lateral, rostral, and caudal. Scale bars: (A,B) = 1 mm; (C–H) = 300 μm; (J) = 500 μm.
Figure 10
Figure 10
Mossy fiber projections from the nucleus of the basal optic root (nBOR) and lentiformis mesencephali (LM) to the zebrin (ZII) stripes in folium IXcd. (A) and (B) Show injections of green and red biotinylated dextran amine in nBOR and LM, respectively. (C) Shows a coronal section through IXcd reacted for ZII. The green terminal labeling from the nBOR is clustered adjacent to the ZII immunopositive (ZII+ve) stripes. (D) Shows a reconstruction of folium IXcd from serial sections. Each green and red dot represents a labeled terminal rosette from the injections in nBOR and LM, respectively, and the ZII+ve stripes are indicated in black. Note that most of the labeling is adjacent to the ZII+ve stripes. From Pakan et al. (2010). ?: Small immunopositive satellite band one to two Purkinje cells wide in the middle of P1−; Scale bars: (A,B) = 200 μm; (C) = 100 μm.
Figure 11
Figure 11
Mossy fiber projections to the posterior cerebellum. From an injection of green LumaFluor in folium VII, retrogradely labeled cells were found in the medial subnucleus of lentiformis mesencephali (LMm) (A) and the potine nuclei (B). From an injection of red LumaFluor in folium IXcd, cells were labeled in nBOR (not shown) and the lateral subnucleus of LM (A). (C) Shows the relative proportion of cells labeled in LMm (gray bars) and LMl (black bars) from injections in IXcd (left) and folia VI–VIII (right), collapsed from several cases. (D) Shows how in VI–VIII there is an integration of optic flow information, from LMm, with local motion information from a tecto-pontine system. From Pakan and Wylie (2006). LMi: intercalated subnucleus of LM. Scale bars: (A,B) = 100 μm.

References

    1. Ahn A. H., Dziennis S., Hawkes R., Herrup K. (1994). The cloning of zebrin II reveals its identity with aldolase C. Development 120, 2081–2090 - PubMed
    1. Andersson G., Oscarsson O. (1978). Climbing fiber microzones in cerebellar vermis and their projection to different groups of cells in the lateral vestibular nucleus. Exp. Brain Res. 32, 565–579 - PubMed
    1. Arends J. J. A., Voogd J. (1989). Topographic aspects of the olivocerebellar system in the pigeon. Exp. Brain Res. 17(Suppl.), 52–57
    1. Barmack N. H., Shojaku H. (1992). Representation of a postural coordinate system in the nodulus of the rabbit cerebellum by vestibular climbing fiber signals, in Vestibular Control of Eye, Head and Body Movements, eds Shimazu H., Shinoda Y. (Tokyo; Japan Scientific Societies Press; Basel: Karger; ), 331–338
    1. Brauth S. E., Karten H. J. (1977). Direct accessory optic projections to vestibulo-cerebellum– possible channel for oculomotor control-systems. Exp. Brain Res. 28, 73–84 - PubMed

LinkOut - more resources