. 2013 Mar;296(3):495-503.
doi: 10.1002/ar.22659.

Alveolar epithelial dynamics in postpneumonectomy lung growth

Affiliations

Alveolar epithelial dynamics in postpneumonectomy lung growth

Kenji Chamoto et al. Anat Rec (Hoboken). 2013 Mar.

Abstract

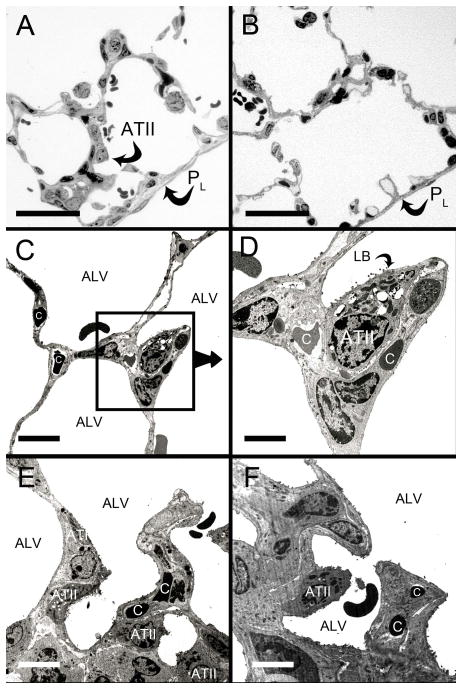
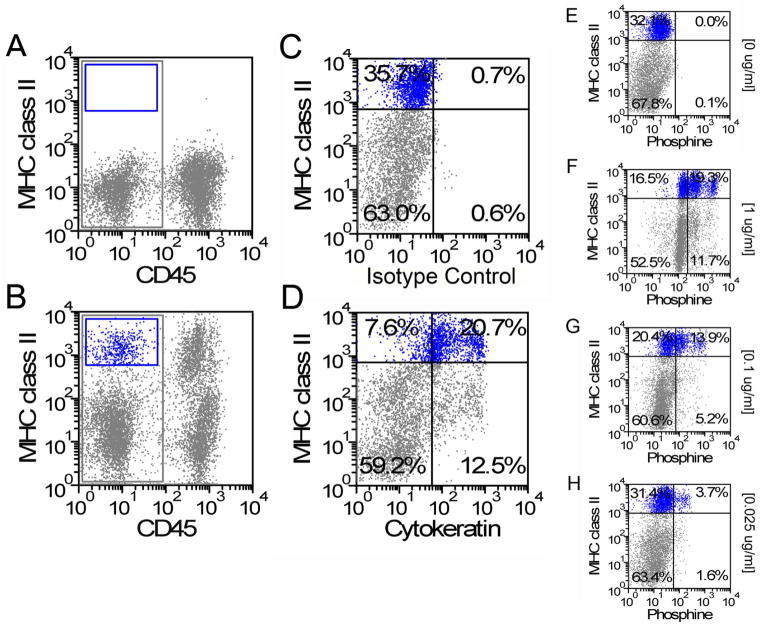
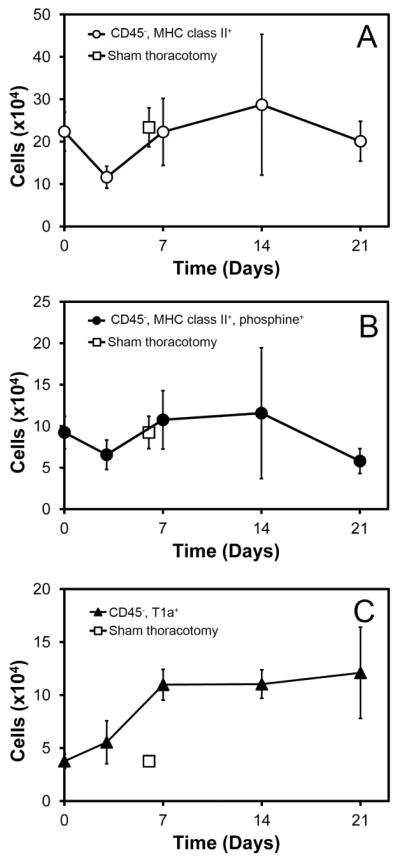
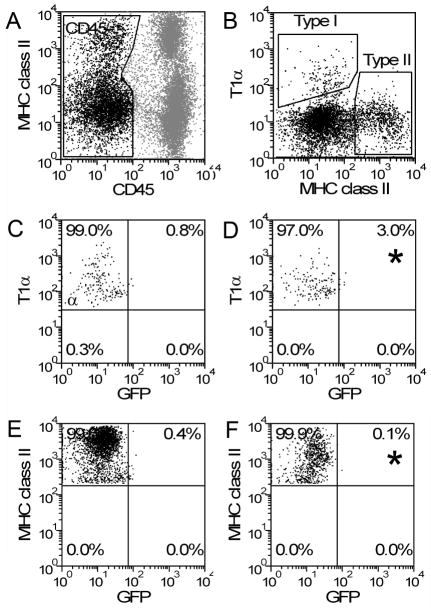
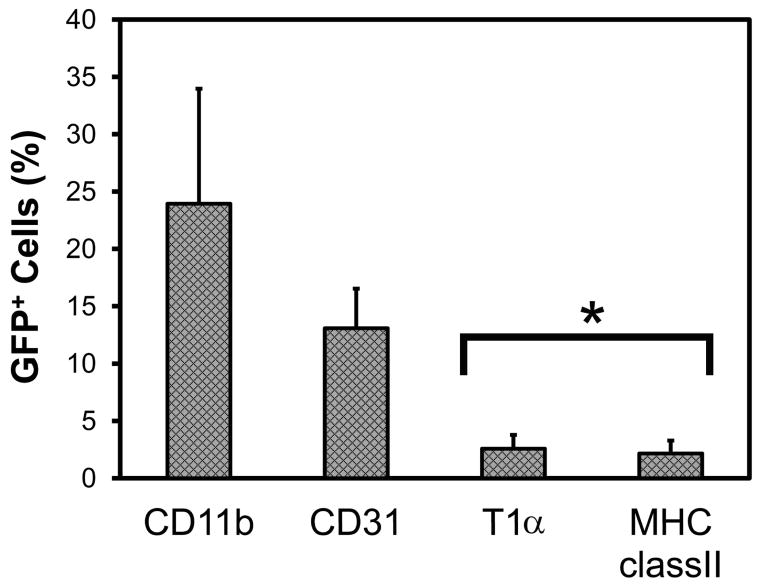
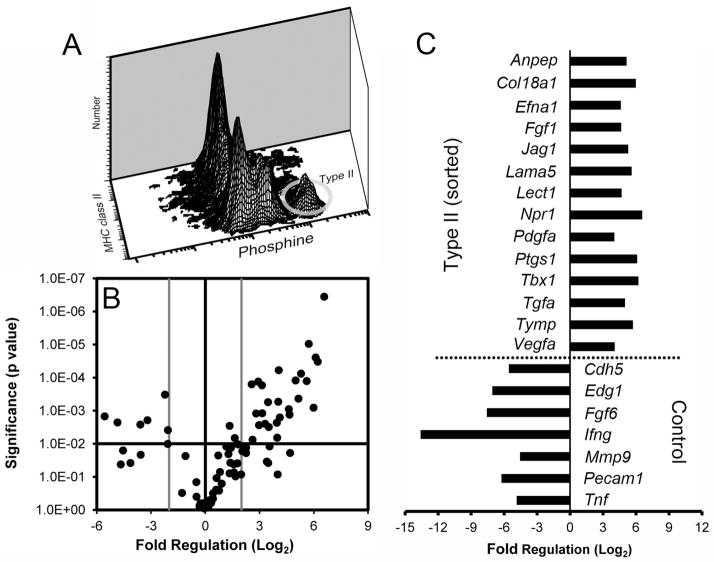
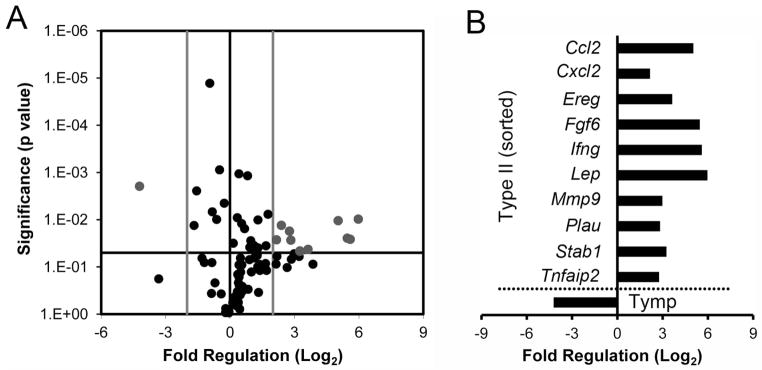
The intimate anatomic and functional relationship between epithelial cells and endothelial cells within the alveolus suggests the likelihood of a coordinated response during postpneumonectomy lung growth. To define the population dynamics and potential contribution of alveolar epithelial cells to alveolar angiogenesis, we studied alveolar Type II and I cells during the 21 days after pneumonectomy. Alveolar Type II cells were defined and isolated by flow cytometry using a CD45(-) , MHC class II(+) , phosphine(+) phenotype. These phenotypically defined alveolar Type II cells demonstrated an increase in cell number after pneumonectomy; the increase in cell number preceded the increase in Type I (T1α(+) ) cells. Using a parabiotic wild type/GFP pneumonectomy model, <3% of the Type II cells and 1% of the Type I cells were positive for GFP-a finding consistent with the absence of a blood-borne contribution to alveolar epithelial cells. The CD45(-) , MHC class II(+) , phosphine(+) Type II cells demonstrated the active transcription of angiogenesis-related genes both before and after pneumonectomy. When the Type II cells on Day 7 after pneumonectomy were compared to nonsurgical controls, 10 genes demonstrated significantly increased expression (P<0.05). In contrast to the normal adult Type II cells, there was notable expression of inflammation-associated genes (Ccl2, Cxcl2, Ifng) as well as genes associated with epithelial growth (Ereg, Lep). Together, the data suggest an active contribution of local alveolar Type II cells to alveolar growth.


Figures

Figure 1
Figure 1
Subpleural changes in the cardiac lobe after pneumonectomy. Light microscopic images of semithin sections 9 days after pneumonectomy (A) and control (B). The pleural surface (PL) was lined by mesothelial cells (arrows). The alveolar septa (arrowheads) appeared narrower in the controls. The light microscopic impression of increased numbers of Type II pneumocytes (ATII) was studied by transmission electron microscopy (TEM). TEM 3 days (C, D) and 9 days (E, F) revealed close spatial correlation between Type II cells, septa and capillaries (C) in the alveoli (ALV). Bars in A and B = 50 μm, in C, E = 30 μm, D= 15 μm, F= 20μm.
Figure 2
Figure 2
Phenotypic definition of alveolar Type II cells. Isotype controls (A) were used to define CD45, MHC class II+ cells (B). Gating on the CD45, MHC class II+ cells, the cytokeratin isotype controls (C) permitted a definition of the CD45, MHC class II+, cytokeratin+ Type II cells (D). Similarly, gating on the CD45, MHC class II+ cells, a titration of phosphine (E=0ug/ml, F=1ug/ml, G=0.1ug/ml and H=0.025 ug/ml) demonstrated an optimal concentration of 0.1 ug/ml (G).
Figure 3
Figure 3
Population dynamics of alveolar epithelial cells after left pneumonectomy (day 0). A) Number of Type II cells (defined CD45, MHC class II+) on days 3, 7, 14 and 21 days after pneumonectomy. B) Alveolar Type II cells (defined CD45, MHC class II+, phosphine+) at the same time points after pneumonectomy. C) Number of alveolar Type I cells (defined as CD45, T1α+) after pneumonectomy. The cell number on days 7, 14 and 21 was significantly increased relative to both sham and day 0 controls (p<.05). A–C) The sham thoracotomy controls are shown on day 7 (open square). N=4 each time point; error bars reflect ± 1 SD.
Figure 4
Figure 4
Blood-derived Type I and Type II cells on day 14 after pneumonectomy. Pneumonectomies were performed in WT/GFP parabionts with established cross-circulation. The remaining lung was studied on day 14 after pneumonectomy. Gating on CD45 cells (A), the cells defined as Type I (T1α+) and Type II (MHC class II+) were analyzed for GFP expression. Defining regions based on WT Type I (C) and Type II (E) cells, GFP expression was identified in Type I (D) and Type II (F) cells (asterisk).
Figure 5
Figure 5
Blood-derived cells in the lung on day 14 after pneumonectomy in WT/GFP parabionts. Defined by GFP+ expression, analysis of alveolar Type I (CD45, T1α+) and Type II (CD45, MHC class II+) cells demonstrated few GFP+ cells relative to blood-derived leukocytes (CD11b+) and endothelial cells (CD45, CD31+). N=6–7 mice; p<.001 (asterisk).
Figure 6
Figure 6
The transcriptional profile of flow cytometry-derived alveolar Type II cells. A) The Type II cells, defined as CD45, MHC class II+, phosphine+, were identified as a discrete population by multidimensional flow cytometry (ellipse). B) Type II cell angiogenesis gene expression was compared to the larger population of CD45, CD31 (“Control”) cells using PCR arrays. The log2 fold-change in gene expression was plotted against the p-value (t-test) to produce a “volcano plot.” The vertical threshold reflected the relative statistical significance (black horizontal line, -log10, p < 0.01); the horizontal threshold reflected the relative fold-change in gene expression (gray vertical line, 4-fold). The specific genes with significantly altered expression (gray) are summarized (C). Each plate was replicated 4 times; 2–4 mice were pooled per plate.
Figure 7
Figure 7
Gene transcription of alveolar Type II cells after pneumonectomy. Gene transcription in the remaining lung on day 7 after pneumonectomy was compared to age-matched non-surgical controls. A) The log2 fold-change in gene expression was plotted against the p-value (t-test) to produce a “volcano plot.” The vertical threshold reflected the relative statistical significance (black horizontal line, -log10, p < 0.05); the horizontal threshold reflected the relative fold-change in gene expression (gray vertical line, 4-fold). The specific genes with significantly altered expression (gray) are summarized (B). Enhanced gene transcription in the post-pneumonectomy was demonstrated in 10 genes; one gene (Tymp) was higher in the non-surgical control lungs. PCR arrays were replicated 4 times; 2–4 pooled mice per plate.

Similar articles

Cited by

References

    1. Adamson IYR, Bowden DH, Wyatt JP. Oxygen poisoning in mice - ultrastructural and surfactant studies during exposure and recovery. Arch Pathol. 1970;90:463–472. - PubMed
    1. Aso Y, Yoneda K, Kikkawa Y. Morphologic and biochemical study of pulmonary changes induced by bleomycin in mice. Lab Investig. 1976;35:558–568. - PubMed
    1. Bakewell WE, Viviano CJ, Dixon D, Smith GJ, Hook GER. Confocal laser scanning immunofluorescence microscopy of lamellar bodies and pulmonary surfactant protein-a in isolated alveolar type-II cells. Lab Investig. 1991;65:87–95. - PubMed
    1. Bergen HT, Cherlet TC, Manuel P, Scott JE. Identification of leptin receptors in lung and isolated fetal type II cells. Am J Respir Cell Mol Biol. 2002;27:71–77. - PubMed
    1. Blenkinsopp WK. Proliferation of respiratory tract epithelium in rat. Exp Cell Res. 1967;46:144–154. - PubMed

Publication types

MeSH terms

LinkOut - more resources