. 2013 Apr;41(7):4000-14.
doi: 10.1093/nar/gkt088. Epub 2013 Feb 13.

Modulation of gene expression via overlapping binding sites exerted by ZNF143, Notch1 and THAP11

Affiliations

Modulation of gene expression via overlapping binding sites exerted by ZNF143, Notch1 and THAP11

Richard Patryk Ngondo-Mbongo et al. Nucleic Acids Res. 2013 Apr.

Abstract

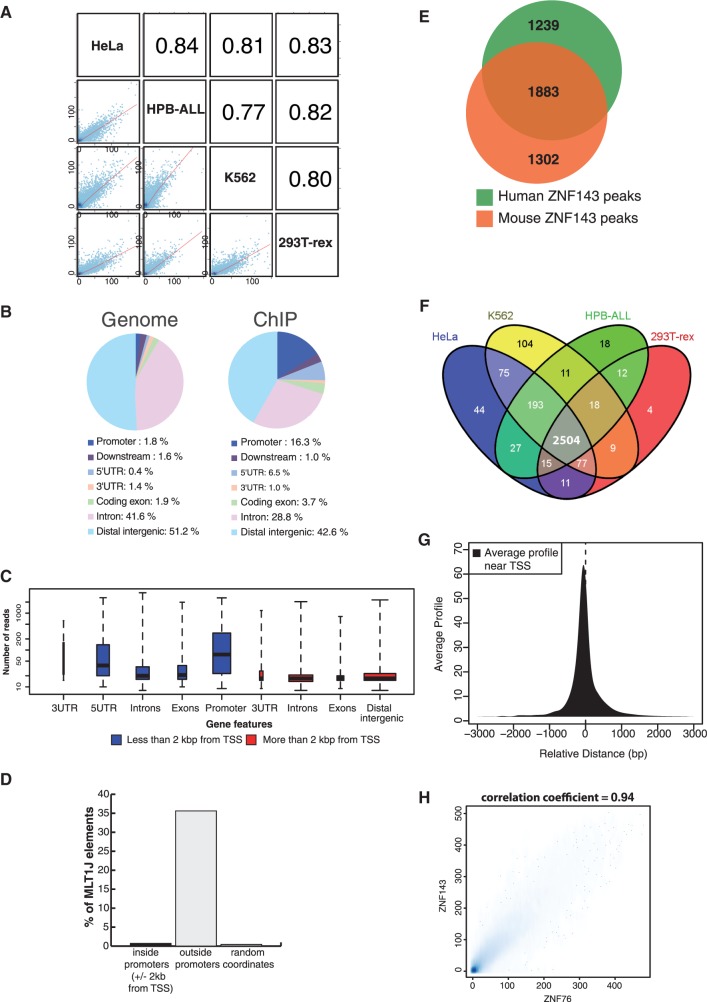
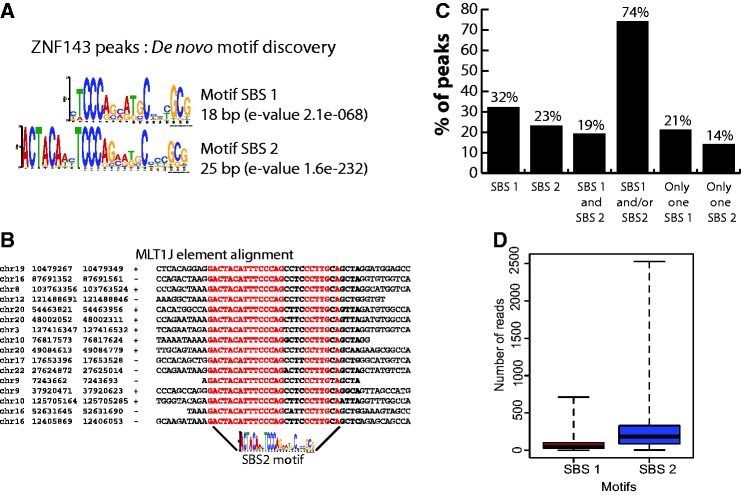
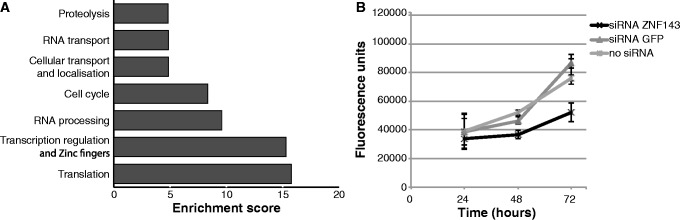
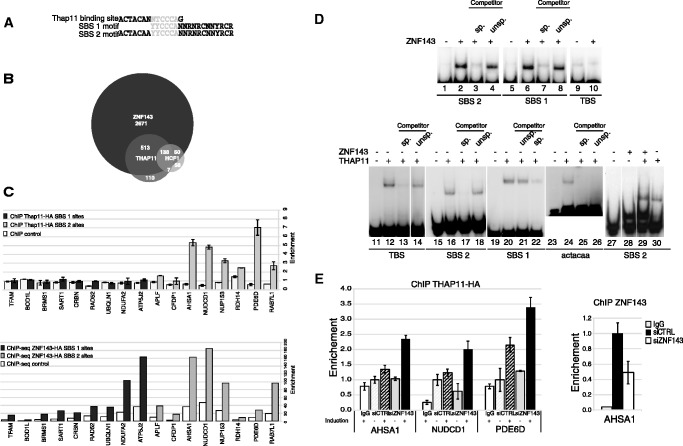
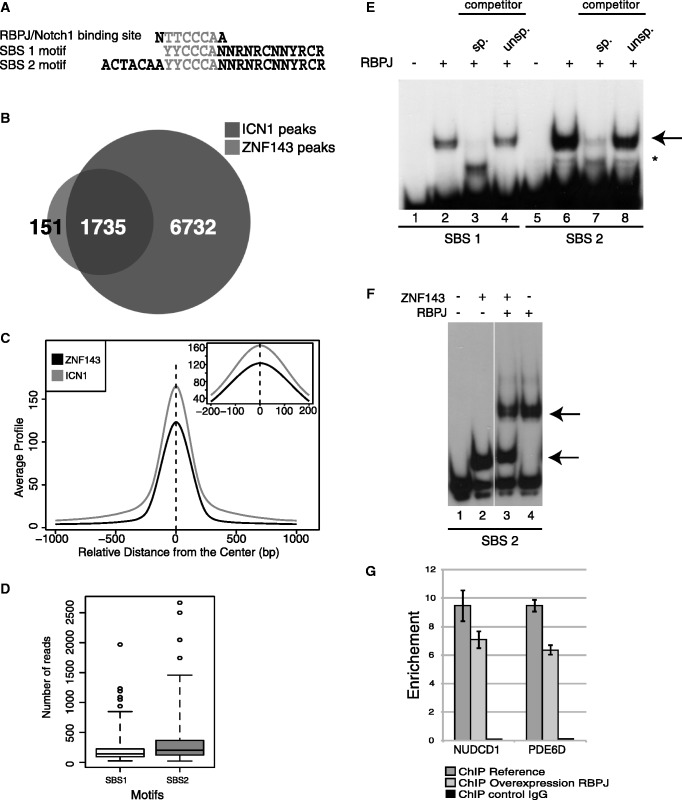
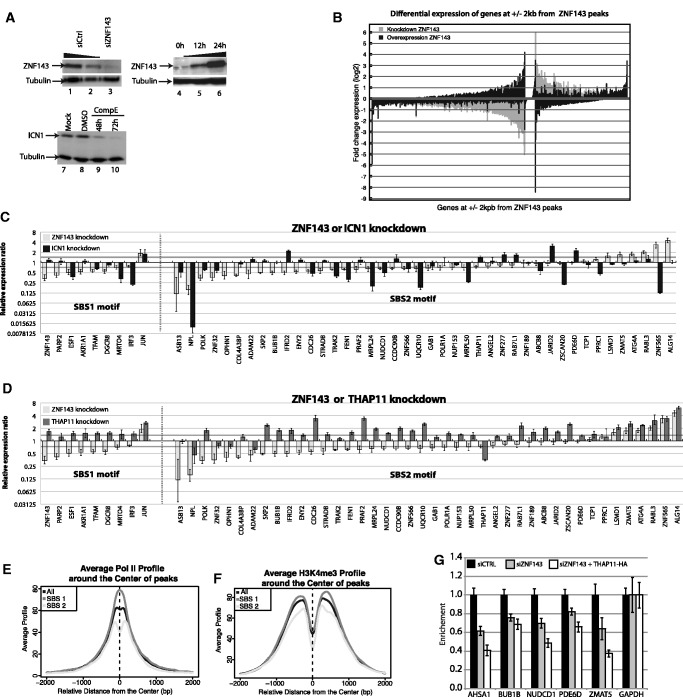
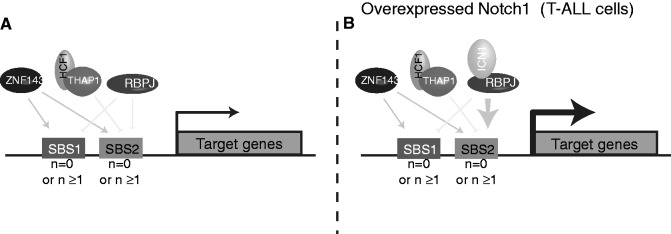
ZNF143 is a zinc-finger protein involved in the transcriptional regulation of both coding and non-coding genes from polymerase II and III promoters. Our study deciphers the genome-wide regulatory role of ZNF143 in relation with the two previously unrelated transcription factors Notch1/ICN1 and thanatos-associated protein 11 (THAP11) in several human and murine cells. We show that two distinct motifs, SBS1 and SBS2, are associated to ZNF143-binding events in promoters of >3000 genes. Without co-occupation, these sites are also bound by Notch1/ICN1 in T-lymphoblastic leukaemia cells as well as by THAP11, a factor involved in self-renewal of embryonic stem cells. We present evidence that ICN1 binding overlaps with ZNF143 binding events at the SBS1 and SBS2 motifs, whereas the overlap occurs only at SBS2 for THAP11. We demonstrate that the three factors modulate expression of common target genes through the mutually exclusive occupation of overlapping binding sites. The model we propose predicts that the binding competition between the three factors controls biological processes such as rapid cell growth of both neoplastic and stem cells. Overall, our study establishes a novel relationship between ZNF143, THAP11 and ICN1 and reveals important insights into ZNF143-mediated gene regulation.


Figures

Figure 1.
Figure 1.
Genome-wide characterization of ZNF143-binding events in human and mouse cells. (A) Correlation plots of ZNF143-binding events in four human cell lines. Grid of pairwise scatter plots with associated Pearson correlation coefficient obtained using Cistrome software (33). The blue dots coordinates represent the normalized enrichments in reads for each cell lines at all the peaks coordinates (Supplementary Table S1). The regression line is indicated in red and the Pearson correlation coefficients are indicated in the squares on the top right (B) Pie charts showing distribution of the ZNF143-binding events in different genomic regions. A promoter is defined as a region within −2 kb from the TSS of a gene; downstream, 2 kb downstream of the end of a gene; the distal intergenic are regions excluding a promoter, downstream, 5′UTR, 3'UTR, introns and exons. Distribution of the different genomic regions in the human genome is given as a reference. Analysis was performed using the coordinates of the peaks summit in HeLa-S3 cells (Supplementary Table S1, P-value threshold of 10−5) expanded to 400 bp (+/−200 bp on both sides of the summit). (C) Box plots depicting the read enrichment of peaks located in various genomic regions. The peaks and enrichment value (in number of reads) are from the HeLa-S3 ChIP-Seq experiment. The blue and red box plots correspond to genomic regions located at less and more than 2 kb from a TSS, respectively. The size of each population of peaks is reflected by the width of the plot. (D) Distribution of MLT1J elements in ZNF143 peaks located inside (+/−2 kb from a TSS) and outside of promoters. The random coordinates were generated, 10 times, by random permutation of the set of peak coordinates located outside promoters across the genome. MLT1J elements are expressed in percentage of MLT1J in repeat elements that overlap ZNF143-binding events. (E) Venn diagram depicting the overlap of ZNF143-binding events located inside promoters in mouse and human cells, respectively. The analysis was performed using the complete data set listed in Supplementary Tables S4 and S5 with coordinate conversion from mm9 to hg19. (F) Venn diagram showing the overlap between the ZNF143-binding events identified at +/−2 kb from a TSS (Supplementary Table S4) in HeLa-S3, K562, 293T-Rex and HPB-ALL human cells. (G) Positional preference of the ZNF143-binding events in promoters. Average profile of the 3122 human ZNF143-binding events (Supplementary Table S4) located at +/−2 kb from a TSS. Positions are given in nucleotides (nt), and negative values correspond to locations upstream from the TSS. (H) Comparison between all the ZNF143- and ZNF76-binding events identified by ChIP-Seq in stable cell lines expressing ZNF143-HA or ZNF76. The scatter plot represents the enrichment correlation of both experiments (Supplementary Table S1). Scale represents normalized number of reads.
Figure 2.
Figure 2.
Identification and characterization of ZNF143-binding motifs. (A) Sequence logo depicting the SBS1 and SBS2 motifs discovered de novo at +/−100 bp ZNF143 peak summits in human and mouse genomes, using the MEME suite (34). (B) Multiple sequence alignment depicting some of the MLTIJ elements that are bound by ZNF143. Coordinates of the repeated elements are shown on the left with indication of the orientation of the element (+/−). (C) ZNF143-binding event counts in human genome associated with SBS1, SBS2, SBS1 and SBS2, a single SBS1 or a single SBS2 motif. (D) Box blots showing ChIP-Seq score (number of reads) distribution of ZNF143-binding events containing: only SBS1 or SBS2 motifs.
Figure 3.
Figure 3.
ZNF143-targeted genes are involved in cell growth and proliferation. (A) Functional categories enriched among the genes located at +/−2 kb of the identified ZNF143-binding events common to HeLa-S3, K562, T-Rex-293 and HPB-ALL cell line (Supplementary Table S4), as reported by the DAVID web-based functional annotation program (36). Values are fold-enrichment scores compared with the whole set of human genes used as background. (B) Cell proliferation assay performed for a 72 h time course on HeLa-S3 cells non-transfected (no siRNA) or transfected with siRNA-targeting ZNF143 or GFP. Results are expressed as means +/− standard deviation of three biological replicates.
Figure 4.
Figure 4.
Overlapping of ZNF143 and Thap11 DNA-binding events. (A) Sequence alignment of the TBS, SBS1 and SBS2 motifs. The sequence indicated in light grey is shared by the three motifs. (B) Venn diagram depicting the overlap of ZNF143/Zfp143-, Thap11- and Hcf1-binding events in mouse ES cells. The analysis was performed using the complete data set listed in Supplementary Table S5 and published ChIP-Seq data (25). (C) Histograms depicting the enrichment of genomic regions containing only SBS1 or SBS2 motifs in ChIP samples. ChIP assays with anti-HA antibody were performed on induced FLP143-HA and FLPTHAP11-HA stable cell lines. Uninduced stable cell lines were used as control. THAP11-HA data are obtained from ChIP-qPCR experiment, amplifying a promoter region containing the binding site. Primer sequences are available on request. ZNF143-HA data are obtained from ChIP-Seq experiment, using read number values in regions amplified by qPCR for THAP11-HA, expanded to 200 bp. SBS1 sites and SBS2 sites correspond to promoters containing only the SBS1 motif or only the SBS2 motif, respectively. Fold enrichment in promoters was normalized to control regions located at 2 kb of tested promoters. The gene symbols listed are those of the genes closest to the tested genomic region. (D) ZNF143 and THAP11 in vitro binding assays on SBS1, SBS2, TBS and TBS sub-motif. Gel retardation assays were performed with 32P labelled double-stranded fragment containing the indicated motif. The labelled probe was incubated in the presence (+) or absence (−) of ZNF143 or THAP11 DBD. The reactions in lanes 3, 7, 13, 17, 22, 25 and 4, 8, 14, 18, 21 were performed in the presence of an excess of unlabelled specific (sp.) or unspecific (unsp.) competitors. The ACTACAA probe corresponds to the 5′part of the TBS. Each lane presented in a single panel of the gel picture was from the same gel and the same exposure of the autoradiogram. (E) Histograms depicting the enrichment of promoter regions containing SBS2 motifs in ChIP samples. ChIP assays with anti-HA antibody were performed on induced or non-induced FLPTHAP11-HA stable cell line, transfected with siRNA targeting ZNF143 (siZNF143) or GFP (siCTRL). Control ChIP assays were performed with non-specific immunoglobulin G (IgG) and ZNF143 knockdown control with anti-ZNF143 antibodies on cells treated with siRNA targeting ZNF143. The gene symbols listed are those of the genes closest to the tested genomic region.
Figure 5.
Figure 5.
ICN1-binding regions co-localize with the ZNF143-binding events. (A) Sequence alignment of the RBPJ-binding site, SBS1 and SBS2 motifs. (B) Venn diagram depicting the overlap of ZNF143 and ICN1-binding events in HPB-ALL cells. (C) Overlap of ICN1 sites with ZNF143-binding sites in HPB-ALL cells. Average profile of ICN1 and ZNF143 ChIP-Seq signals around the centre of all overlapping peaks. (D) Box blots showing ChIP-Seq score (number of reads) distribution of ICN1-binding events associated to SBS1 or SBS2 motifs. (E) RBPJ in vitro binding assays on SBS1 and SBS2 motifs. Gel retardation assays were performed with 32P labelled double stranded fragment containing the indicated motif. The labelled probe was incubated in the presence (+) or absence (−) of RBPJ. Reactions in lanes 3, 7 and 4, 8 were performed in the presence of an excess of unlabelled specific (sp.) or unspecific (unsp.) competitors. The RBPJ–DNA complex is indicated by an arrow, the asterisk denotes an unrelated product. (F) The binding of RBPJ and ZNF143 is mutually exclusive in vitro. Gel retardation assays were performed with 32P labelled double-stranded fragment containing the SBS2 motif in the presence (+) or absence (−) of the indicated proteins. Arrows indicate the RBPJ–DNA and ZNF143–DNA complexes. (G) The binding of RBPJ and ZNF143 is mutually exclusive in vivo. ZNF143-ChIP-qPCR enrichment analysis on promoters bound by ZNF143 and Notch1. ZNF143-ChIP was performed on non-induced (ChIP reference) and induced FLP_RBPJ-HA cells expressing the RBPJ-HA (ChIP over-expression RBPJ) protein. ChIP enrichment was measured by qPCR using specific primers on promoter compared with negative regions located at 2 kb. Primers are available on request. A control ChIP was performed using non-specific IgG antibodies (ChIP control IgG). The gene symbols listed are those of the genes closest to the tested genomic region.
Figure 6.
Figure 6.
ZNF143, THAP11 and ICN1 co-regulate the expression of target genes. (A) Western blots showing (i) knockdown of ZNF143 at 72 h post-transfection of HeLa cells with specific siRNA (lane 3) and siRNA control (lanes 1 and 2); (ii) over-expression of ZNF143 in FLP143 cells at 12 h (lane 5), 24 h (lane 6) post-induction, uninduced cells (lane 4); (iii) knockdown of ICN1 at 48 h and 72 h post- treatment of HPB-ALL cells with 500 nM of GSI (compound E) (lanes 9 and 10), DMSO treated (lane 8) and non-treated cells (lane 7). Tubulin was used as a loading control. (B) Bar chart depicting the RNA-Seq expression profiling of all genes located at +/−2 kb of a ZNF143 peak summit, after knockdown or over-expression of ZNF143. In grey and black are represented the fold change of expression 48 h after siRNA-mediated knockdown and 24 h after induced over-expression of ZNF143 compared with control, respectively. The genes are ordered decreasingly according their positive or negative fold change expression after ZNF143 knockdown. (C) Bar chart depicting the relative gene expression ratio determined by RT-qPCR for genes containing SBS1 or SBS2 sites, after ICN1 and ZNF143 knockdown compared with control. RNA was extracted 72 h post-transfection of HeLa-S3 cells with specific siRNAs targeting ZNF143 and from HPB-ALL cells 72 h post-treatment with 500 nM of GSI (compound E). Values represent the mean +/− SD of two or three independent experiments normalized to the GAPDH level. The dark grey line corresponds to a 0.5-fold expression ratio (D) Bar chart depicting the relative gene expression ratio determined by RT-qPCR for genes containing SBS1 or SBS2 sites, after THAP11 and ZNF143 knockdown compared with control. RNA was extracted 72 h post-transfection of HeLa-S3 cells with specific siRNAs targeting ZNF143 or THAP11. Values represent the mean +/− SD of two or three independent experiments normalized to the GAPDH level. The dark grey line corresponds to a 0.5-fold expression ratio (E) Average ChIP-Seq profile of Pol II and (F) Average profile of H3K4me3 around the centre of ZNF143-binding events identified in HeLa cells at +/−2 kb from a TSS (Supplementary Table S4). All ZNF143-binding events, binding events containing only SBS1 or only SBS2, are indicated in black, dark grey and light grey, respectively. (G) RNA Pol II-ChIP-qPCR enrichment analysis on promoters bound by THAP11 and containing SBS2 sites. Pol II-ChIP was performed on cells treated with control siRNA (siCTRL), knockdown for ZNF143 (siZNF143) or knockdown for ZNF143 and over-expressing THAP11 (siZNF143 + THAP11-HA). ChIP enrichment was measured by qPCR using specific primers on promoter compared with negative regions located at 2 kb. Values represent the mean +/− SD of two or three independent experiments normalized to the GAPDH promoter levels. Primers are available on request. The gene symbols listed are those of the genes closest to the tested genomic region.
Figure 7.
Figure 7.
A model for modulation of gene expression by ZNF143, THAP11 and ICN1. The model considers single or multiple SBS1 and/or SBS2 motifs (n = 0 or n ≥ 1) in promoters. ZNF143 activates the expression of genes through both SBS1 and SBS2 sites. THAP11 represses the expression of genes only through SBS2 sites. Instead, genes that are regularly repressed by RBPJ through SBS1 and SBS2 sites (A) are activated in T-ALL cells when ICN1 is over-expressed (B).

Similar articles

Cited by

References

    1. Vaquerizas JM, Kummerfeld SK, Teichmann SA, Luscombe NM. A census of human transcription factors: function, expression and evolution. Nat. Rev. Genet. 2009;10:252–263. - PubMed
    1. Lenhard B, Sandelin A, Carninci P. Regulatory elements: Metazoan promoters: emerging characteristics and insights into transcriptional regulation. Nat. Rev. Genet. 2012;13:233–245. - PubMed
    1. Spitz F, Furlong EEM. Transcription factors: from enhancer binding to developmental control. Nat. Rev. Genet. 2012;13:613–626. - PubMed
    1. Macquarrie KL, Fong AP, Morse RH, Tapscott SJ. Genome-wide transcription factor binding: beyond direct target regulation. Trends Genet. 2011;27:141–148. - PMC - PubMed
    1. Rosenbloom KR, Dreszer TR, Long JC, Malladi VS, Sloan CA, Raney BJ, Cline MS, Karolchik D, Barber GP, Clawson H, et al. ENCODE whole-genome data in the UCSC Genome Browser: update 2012. Nucleic Acids Res. 2012;40:D912–D917. - PMC - PubMed

Publication types