. 2013;9(2):e1002887.
doi: 10.1371/journal.pcbi.1002887. Epub 2013 Feb 7.

Linking proteomic and transcriptional data through the interactome and epigenome reveals a map of oncogene-induced signaling

Affiliations

Linking proteomic and transcriptional data through the interactome and epigenome reveals a map of oncogene-induced signaling

Shao-shan Carol Huang et al. PLoS Comput Biol. 2013.

Abstract

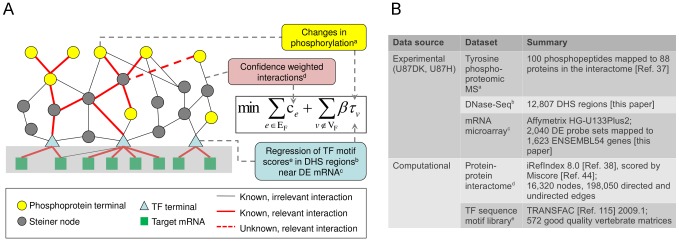
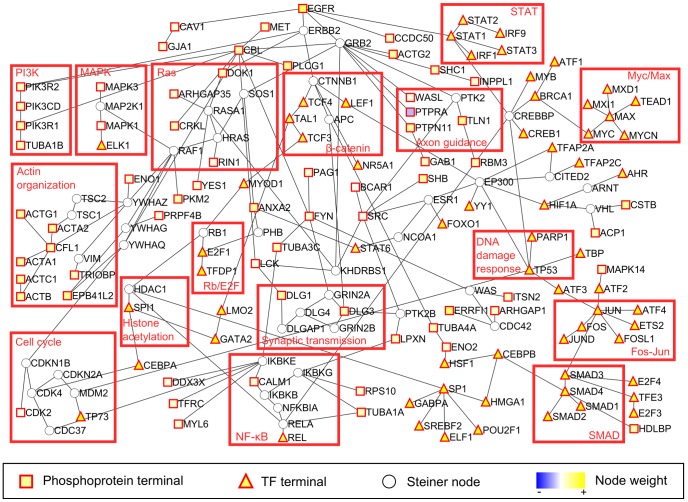
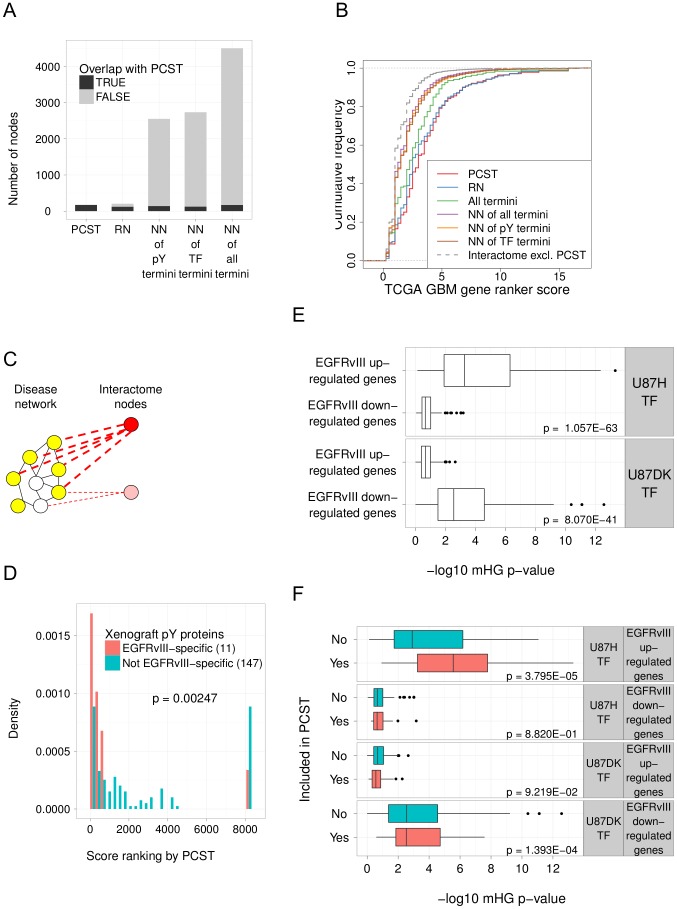
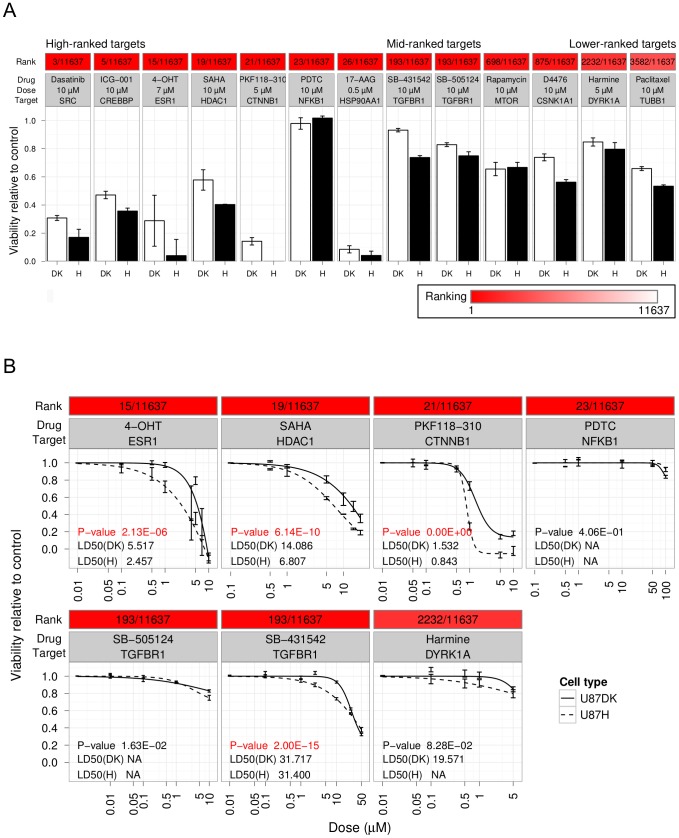
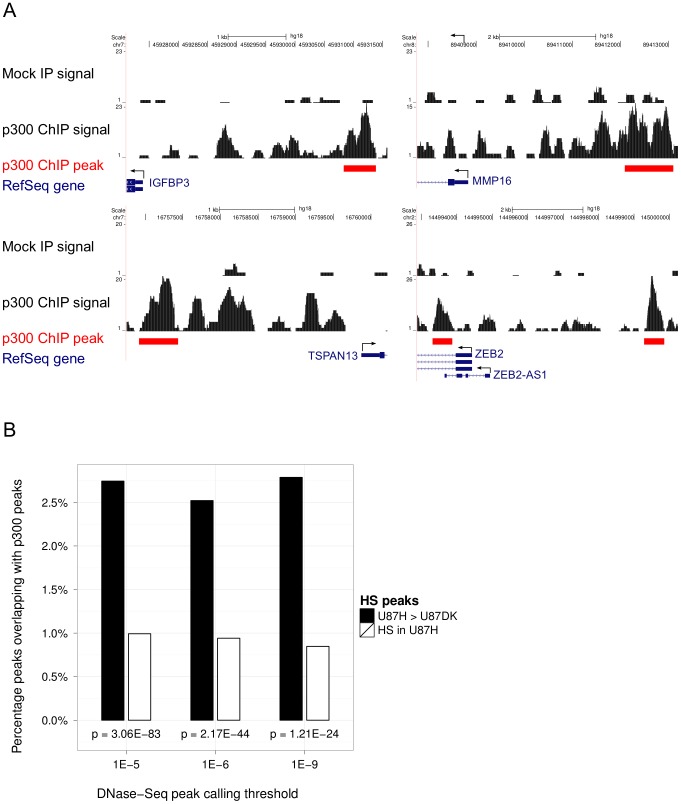
Cellular signal transduction generally involves cascades of post-translational protein modifications that rapidly catalyze changes in protein-DNA interactions and gene expression. High-throughput measurements are improving our ability to study each of these stages individually, but do not capture the connections between them. Here we present an approach for building a network of physical links among these data that can be used to prioritize targets for pharmacological intervention. Our method recovers the critical missing links between proteomic and transcriptional data by relating changes in chromatin accessibility to changes in expression and then uses these links to connect proteomic and transcriptome data. We applied our approach to integrate epigenomic, phosphoproteomic and transcriptome changes induced by the variant III mutation of the epidermal growth factor receptor (EGFRvIII) in a cell line model of glioblastoma multiforme (GBM). To test the relevance of the network, we used small molecules to target highly connected nodes implicated by the network model that were not detected by the experimental data in isolation and we found that a large fraction of these agents alter cell viability. Among these are two compounds, ICG-001, targeting CREB binding protein (CREBBP), and PKF118-310, targeting β-catenin (CTNNB1), which have not been tested previously for effectiveness against GBM. At the level of transcriptional regulation, we used chromatin immunoprecipitation sequencing (ChIP-Seq) to experimentally determine the genome-wide binding locations of p300, a transcriptional co-regulator highly connected in the network. Analysis of p300 target genes suggested its role in tumorigenesis. We propose that this general method, in which experimental measurements are used as constraints for building regulatory networks from the interactome while taking into account noise and missing data, should be applicable to a wide range of high-throughput datasets.


Conflict of interest statement

The authors have declared that no competing interests exist.

Figures

Figure 1
Figure 1. Setting up the PCST problem.
A. Finding a network of interactions that link phosphorylation events and differentially transcribed genes can be formulated as an optimization problem on a protein interactome. The objective function (equation in box) represents a balance between excluding nodes for which there is experimental evidence (phosphorylated proteins as yellow circles and transcription factors as blue triangles) and including edges weighted by reliability. The light grey rectangle containing edges from transcription factors to target mRNAs indicates these edges are not directly included in the interactome. Instead, they are used to infer the activity of transcription factor candidates (see Materials and Methods). The optimal solution to the PCST problem connects the phoshoprotein termini and the transcription factor termini by reliable interactions (red lines) that may involve nodes not explicitly observed in the experimental data (Steiner nodes; dark grey circles). TF: transcription factor. DHS: differentially hypersensitive. DE: differential expression. The superscripts a to e correspond to the superscript labels of input data types in B. B. The input datasets from U87MG EGFRvIII-expressing cells used in this study.
Figure 2
Figure 2. PCST constructed from the U87 datasets.
This is a composite network representing the union of the optimal solution to the original PCST problem and 10 suboptimal solutions where 15 percent of the nodes must be different from the optimal solution. TF: transcription factor. Node weight: the log2 fold changes in phosphorylation from the phosphoproteomic data comparing U87H to U87DK cells, or values from the expression regression procedure using the mRNA microarray, DNase-Seq and transcription factor motif data. The absolute value of node weights was used as penalty values for the PCST algorithm.
Figure 3
Figure 3. The PCST solution network is compact, relevant to GBM and specific to EGFRvIII.
A. The number of nodes in networks constructed from multiple approaches and their overlap with the PCST solution. NN of pY termini: the proteins containing phosphorylated tyrosine residues reported by mass-spectrometry and their direct interactors (nearest neighbors) in the interactome. NN of TF termini: transcription factor candidates selected by the expression regression procedure and their direct interactors in the interactome. NN of all termini: the union of pY termini, TF termini and their direct interactors in the interactome. RN: a network constructed by using a flow based approach ResponseNet to connect the pY termini to the TF termini. B. GBM gene ranker scores for nodes included in the PCST solution were significantly higher than the nodes excluded from the PCST solution (labeled as “Interactome excl. PCST”; p<2.2E-16 by Wilcoxon rank-sum test) and compared favorably to the nearest neighbor networks. Higher GBM scores indicate greater relevance to the disease. C. Scoring proteins by connectivity to the PCST solution representing a disease network. The score of each protein, whether the protein is inside or outside of the original PCST network, is the sum of the scores of all its interactions with the nodes in the PCST. Thus a node in the interactome (deep red) with many high confidence interactions to the nodes in the PCST disease network receives a higher score than a node in the interactome (light red) that has fewer or lower confidence interactions to the nodes in the PCST. D. Proteins with EGFRvIII regulated tyrosine phosphorylation in mouse xenografts (red bars) are more closely connected to the PCST solution than the proteins on which the tyrosine phosphorylation levels do not change significantly (green bars). Each protein in the interactome was scored then ranked by its connectivity to the PCST solution constructed from the U87 cell line data as described in B and in Materials and Methods. P-value was computed by Wilcoxon rank-sum test comparing the ranks of EGFRvIII-specific and not EGFRvIII specific phosphorylated proteins. The number of proteins in each category is indicated in parentheses. E. The targets for transcription factors identified in condition-specific DNaseI hypersensitive regions are enriched for genes differentially expressed in response to EGFRvIII. U87H TF: transcription factors that have motif matches in regions with increased DNaseI hypersensitivity in the U87H cells and within 40 kb of transcription start sites. U87DK TF: transcription factors that have motif matches in the regions with higher DNaseI hypersensitivity in the U87DK cells and within 40 kb of transcription start sites. EGFRvIII up- and down-regulated genes: genes that are up- or down- regulated in the TCGA GBM exon array dataset comparing EGFRvIII positive samples to wild-type EGFR samples. For each TF, we computed a minimum hypergeometric (mHG) p-value that tested for the probability that the set of target genes are differentially expressed in the TCGA GBM samples by chance. Top panel: U87H TF targets are more enriched (smaller mHG values) in EGFRvIII up-regulated genes than in EGFRvIII down-regulated genes. Bottom panel: U87DK TF targets are more enriched in EGFRvIII down-regulated genes than in EGFRvIII up-regulated genes. P-values were computed by Student's t-test comparing the mHG p-values on EGFRvIII up- and down-regulated genes for each set of TF. F. The transcription factors included in the PCST solution are more enriched in EGFRvIII-induced differential gene expression than the transcription factors excluded from the PCST. Each set of U87H TF and U87DK TF were further divided into whether they were included in the PCST solution, denoted by the “Yes” and “No” categories. First panel: targets of U87H TF included in the PCST solution have stronger enrichment in EGFRvIII up-regulated genes than targets of the TF excluded from the solution. Fourth panel: targets of U87DK TF included in the PCST solution have stronger enrichment in EGFRvIII down-regulated genes than targets of the TF excluded from the PCST. Second and third panel: with respect to the comparison between U87H TF targets and EGFRvIII down-regulated genes, or between U87DK TF targets and EGFRvIII up-regulated genes, the TF included in the PCST do not show significantly stronger enrichment than the TF excluded from the PCST. P-values were computed by Student's t-test comparing the mHG scores of TF included in the PCST and TF excluded from the PCST.
Figure 4
Figure 4. Validation of targets predicted by network connectivity by cell viability assays.
A. Cell viability for treatment with compounds targeting high-scoring nodes (high-ranked targets), intermediate-scoring nodes (mid-ranked targets) and low-scoring nodes (lower-ranked targets), at 0.5 µM concentration of 17-AAG, 5 µM for harmine (due to low solubility in DMSO) and 10 µM concentration of others. The color bar at the top of each target corresponds to its relative ranking within the interactome. B. Dose response curves of compounds targeting high-scoring nodes and lower-scoring nodes for those that can be fitted to the four-parameter log-logistic model (lack-of-fit test p-value>0.05). P-values between cell lines were computed by comparing the model where one curve was fitted to the data from each cell line to the null model where one shared curve was fitted to the data from both cell lines.
Figure 5
Figure 5. ChIP-Seq reveals functional role of p300.
A. EMT marker genes bound by p300 in U87H cells. Shown are genome browser tracks for p300 bound regions near several EMT marker genes, where the horizontal axis represent coordinates along the genome and the height of the solid area represents the number of ChIP-Seq reads mapped to a position in the genome. For each region we show this signal from the ChIP sample that used an antibody specific to p300 (bottom track) and the signal from the sample that used an IgG antibody for non-specific binding (top track). Arrow indicates direction of transcription. B. Regions that are more hypersensitive (HS) in the U87H cells were significantly enriched for overlap with p300 binding regions (p<1E-05) compared to a background of all regions called hypersensitive in U87H cells, for a range of peak calling thresholds of hypersensitivity specified on the x-axis tick marks. Enrichment p-values computed by Fisher exact test are indicated immediately below each set of bars.

Similar articles

Cited by

References

    1. Gil JM, Rego AC (2008) Mechanisms of neurodegeneration in Huntington's disease. Eur J Neurosci 27: 2803–2820 Available:http://dx.doi.org/10.1111/j.1460-9568.2008.06310.x. - DOI - PubMed
    1. Imarisio S, Carmichael J, Korolchuk V, Chen C-W, Saiki S, et al. (2008) Huntington's disease: from pathology and genetics to potential therapies. Biochem J 412: 191–209 Available:http://dx.doi.org/10.1042/BJ20071619. - DOI - PubMed
    1. Schinner S, Scherbaum WA, Bornstein SR, Barthel A (2005) Molecular mechanisms of insulin resistance. Diabet Med 22: 674–682 Available:http://dx.doi.org/10.1111/j.1464-5491.2005.01566.x. - DOI - PubMed
    1. Hanahan D, Weinberg RA (2011) Hallmarks of cancer: the next generation. Cell 144: 646–674 Available:http://dx.doi.org/10.1016/j.cell.2011.02.013. - DOI - PubMed
    1. Hanahan D, Weinberg RA (2000) The hallmarks of cancer. Cell 100: 57–70. - PubMed

Publication types