. 2013;9(2):e1003251.
doi: 10.1371/journal.pgen.1003251. Epub 2013 Feb 7.

Inflammation-mediated genetic and epigenetic alterations drive cancer development in the neighboring epithelium upon stromal abrogation of TGF-β signaling

Affiliations

Inflammation-mediated genetic and epigenetic alterations drive cancer development in the neighboring epithelium upon stromal abrogation of TGF-β signaling

B R Achyut et al. PLoS Genet. 2013.

Abstract

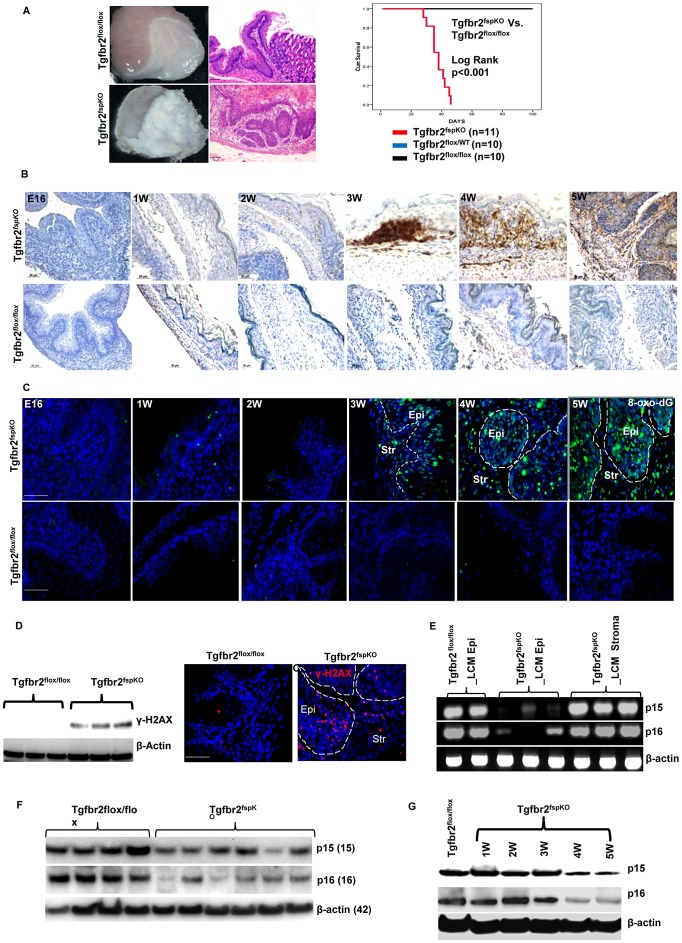
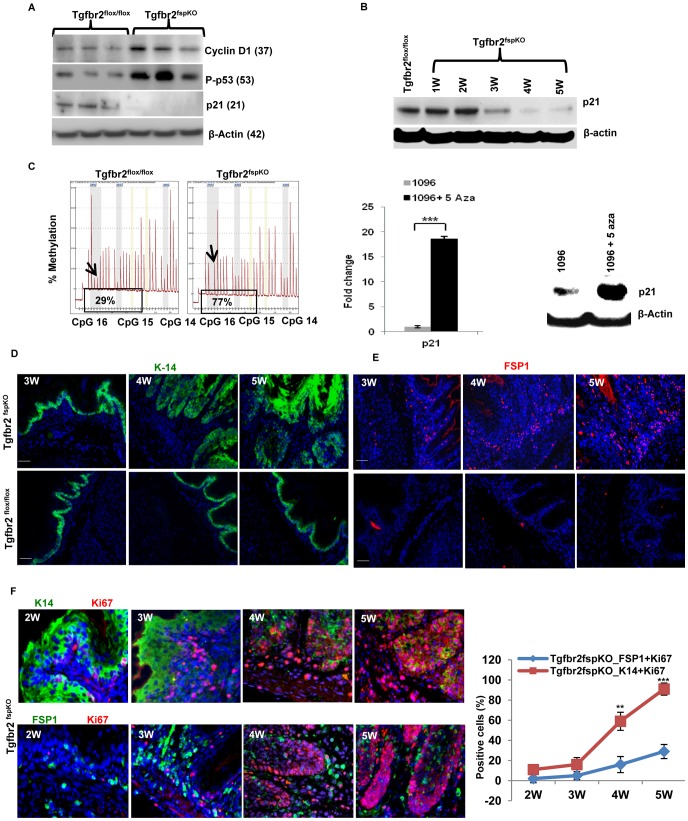
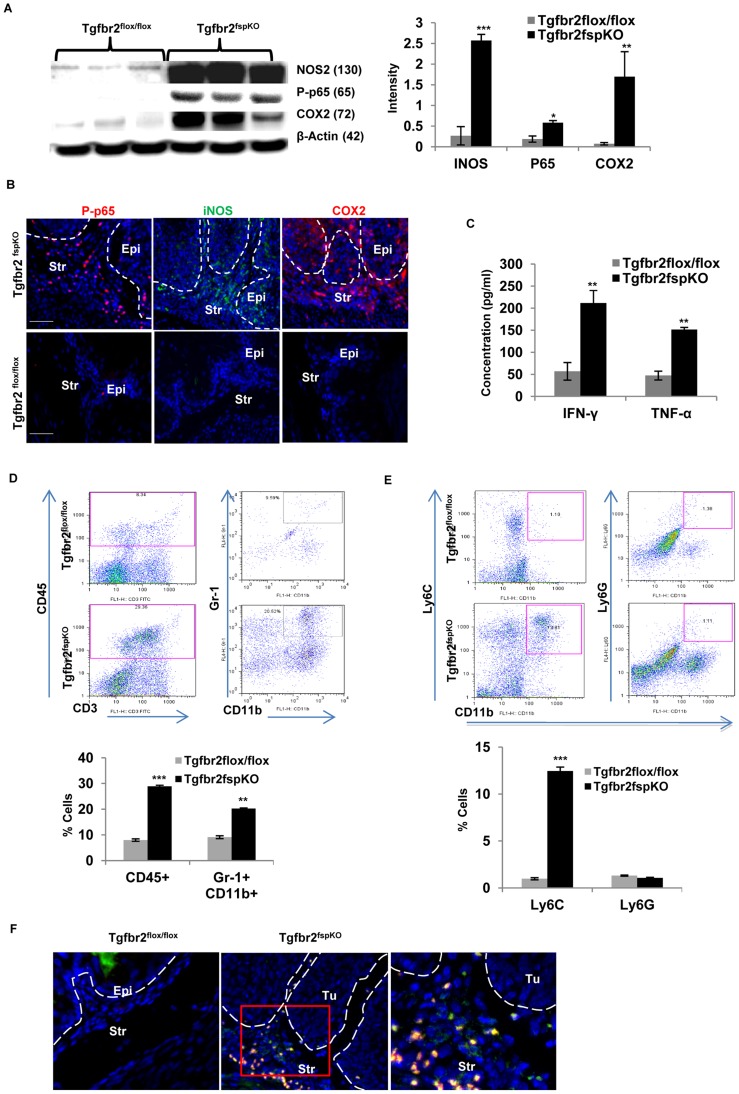
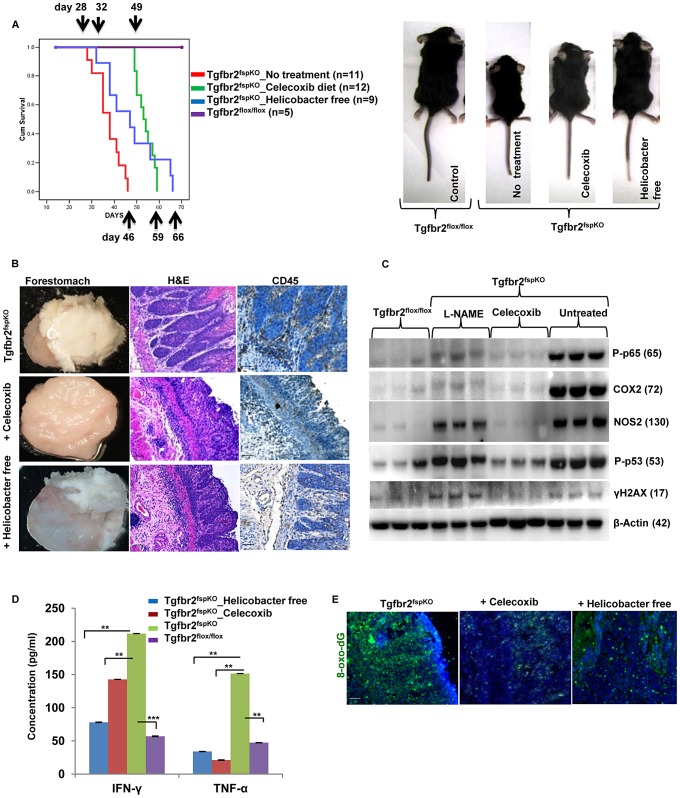
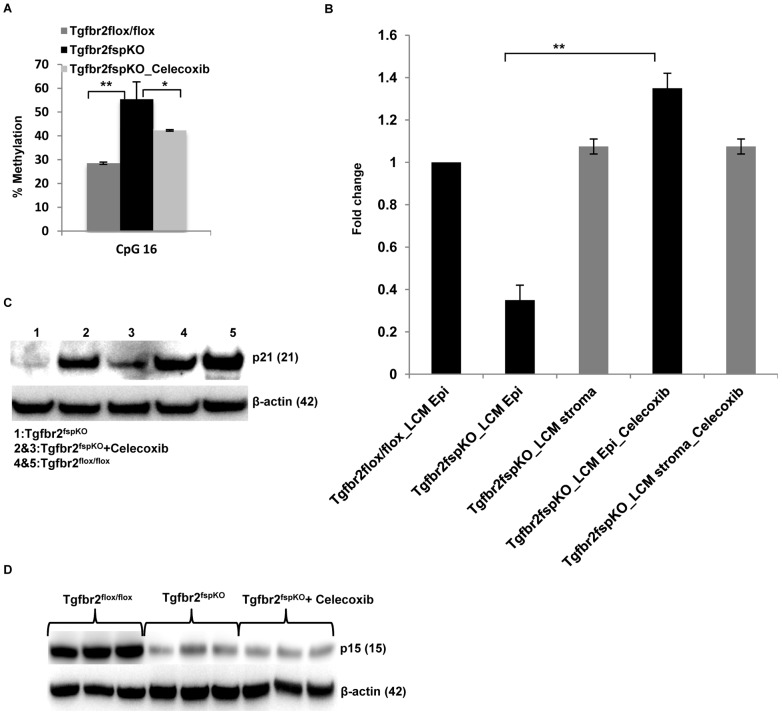
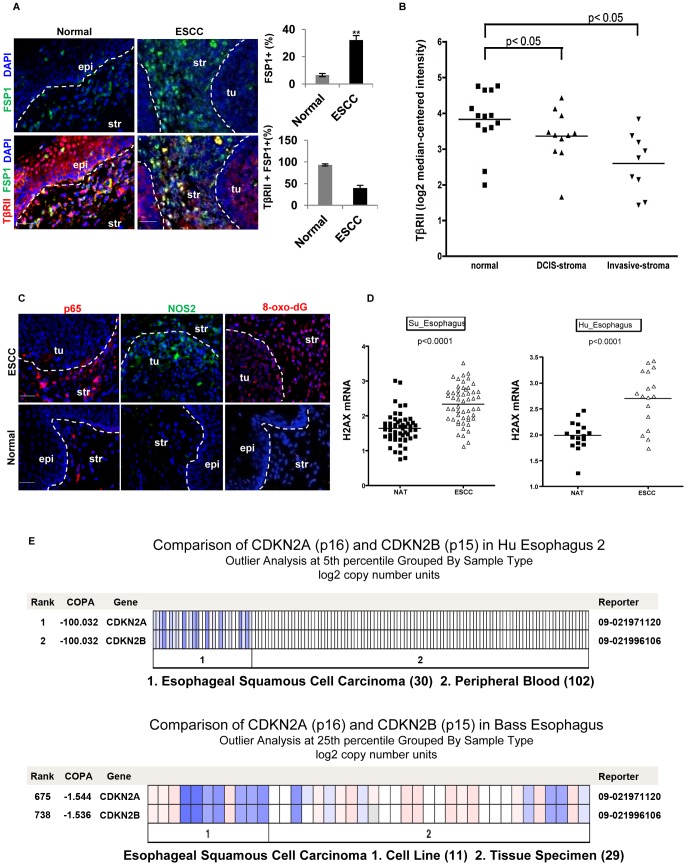
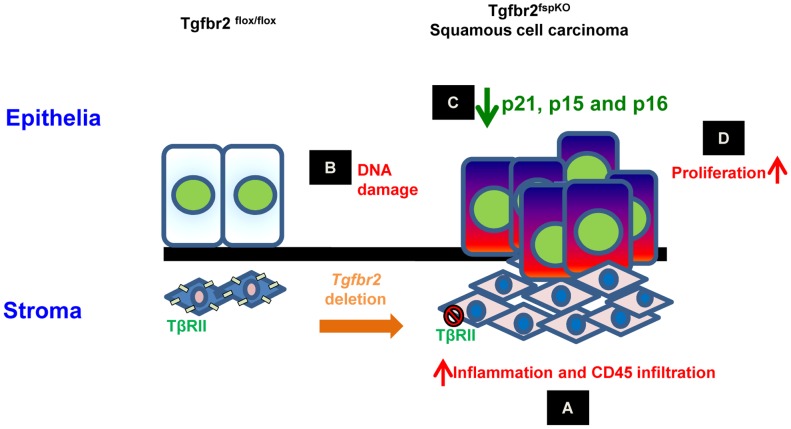
Deletion of tumor suppressor genes in stromal fibroblasts induces epithelial cancer development, suggesting an important role of stroma in epithelial homoeostasis. However, the underlying mechanisms remain to be elucidated. Here we report that deletion of the gene encoding TGFβ receptor 2 (Tgfbr2) in the stromal fibroblasts (Tgfbr2(fspKO)) induces inflammation and significant DNA damage in the neighboring epithelia of the forestomach. This results in loss or down-regulation of cyclin-dependent kinase inhibitors p15, p16, and p21, which contribute to the development of invasive squamous cell carcinoma (SCC). Anti-inflammation treatment restored p21 expression, delayed tumorigenesis, and increased survival of Tgfbr2(fspKO) mice. Our data demonstrate for the first time that inflammation is a critical player in the epigenetic silencing of p21 in tumor progression. Examination of human esophageal SCC showed a down-regulation of TGFβ receptor 2 (TβRII) in the stromal fibroblasts, as well as increased inflammation, DNA damage, and loss or decreased p15/p16 expression. Our study suggests anti-inflammation may be a new therapeutic option in treating human SCCs with down-regulation of TβRII in the stroma.


Conflict of interest statement

The authors have declared that no competing interests exist.

Figures

Figure 1
Figure 1. Stromal deletion of Tgfbr2 promotes inflammation-induced DNA damage and loss of p15 and p16.
(A) Tgfbr2fspKO mice developed forestomach SCC with 100% penetrance (left panel, scale bar: 50 µm). Mice died within 7 weeks with a median survival of 38 days (Kaplan Meier survival curve, Log rank p<0.001) (right panel). (B) IHC of CD45+ leukocytes in forestomach tissues of Tgfbr2fspKO and Tgfbr2flox/flox mice from embryonic day 16 (E16) to 5 weeks. Scale bar: 50 µm. (C) Immunofluorescence staining of 8-oxo-dG of forestomach samples of Tgfbr2fspKO and Tgfbr2flox/flox mice from E16 to 5 weeks. Scale bar: 100 µm. (D) Western blot of γ-H2AX from protein samples of Tgfbr2fspKO and Tgfbr2flox/flox forestomach (n = 3 mice for each group) (left panel), with Immunofluorescence staining of γ-H2AX on the right panels. Scale bar: 100 µm. (E) Genomic PCR of p15 and p16 from epithelial and stromal cells laser-dissected from Tgfbr2fspKO and Tgfbr2flox/flox forestomach tissues. The input for genomic PCRs was normalized with β-actin. (F) Western blot of p15 and p16 in the epithelial layer of forestomach from Tgfbr2fspKO (n = 6) and Tgfbr2flox/flox mice (n = 4). (G) Western blot of time course studies of p15/p16 expression in the epithelial layer of forestomach, showing reduced expression of p15 and p16 from 4 week of age in the Tgfbr2fspKO mice. Str: Stroma; Epi: epithelia.
Figure 2
Figure 2. Methylation of p21 promoter, cell cycle alterations, proliferation, and SCC development.
(A) Western blot of cyclin D1, p53 and p21. Proteins were extracted from the epithelial layer of forestomach tissue of Tgfbr2fspKO and Tgfbr2flox/flox mice (n = 3 for each group). (B) Time course studies of p21 expression by Western blot, showing p21 expression reduced in the forestomach of Tgfbr2fspKO mice at 3 week of age but with more profound reduction at 4 weeks. (C) Pyrosequencing data showing % methylation of p21 promoter (CpG 16) in forestomach tumor samples of Tgfbr2fspKO (77%) compared to that of Tgfbr2flox/flox mice (29%), left panel; increased expression of p21 mRNA (Q-PCR, middle panel) and protein (Western blot, right panel) after 5-aza 2′ deoxycytine treatment. Epithelial cells 1096 was isolated from Tgfbr2fspKO mice and treated at 5 µM dose for 48 hours. (D and E) Immunofluorescence staining of K-14 (D, green) and FSP1 (E, red) in forestomach tissues of Tgfbr2fspKO and Tgfbr2flox/flox mice at 3, 4, and 5 weeks. Scale bar: 50 µm. (F) Co-immunofluorescence staining of Ki-67 (red) with K-14 or FSP-1 (green) showing proliferation in epithelial and stromal compartments in Tgfbr2fspKO mice. Scale bar: 150 µm. **P<0.01 and ***P<0.001. Three mice were evaluated. Shown is one of the two experiments performed.
Figure 3
Figure 3. Inflammatory mediators and tumor microenvironment in SCC.
(A) Western analysis of iNOS, COX2, and p65 in tumor tissue and equivalent normal tissue layer of 5 week old Tgfbr2fspKO and Tgfbr2flox/flox mice (n = 3 for each group), semi-quantitative data from band density is on the right panel (right panel). (B) Immunofluorescence staining of iNOS, COX2, and p65 of forestomach in 4-week-old Tgfbr2fspKO mice compared to Tgfbr2flox/flox control mice. (C) Bioplex assay of IFN-γ and TNF-α of forestomach samples of 5 week old Tgfbr2fspKO and Tgfbr2flox/flox mice. (D) Flow cytometry of CD45+ and Gr-1+CD11b+ cells from single cell suspension of forestomach of Tgfbr2fspKO and Tgfbr2flox/flox mice (dot plots in left panels), with quantitative data in the lower panel. (E) Flow cytometry analysis of LY6C+ and LY6G+ subsets of Gr-1+CD11b+ cells from (D), quantitative data is in the lower panel. (F) Immunofluorescence staining of CD4 and IL17A of forestomach in 5-week-old Tgfbr2fspKO mice compared to Tgfbr2flox/flox control mice. Error bars represent standard deviation (SD). *P<0.05, **P<0.01 and ***P<0.001. Three mice were evaluated in each group. Shown is one of the two experiments performed. Str: Stroma; Epi: epithelia.
Figure 4
Figure 4. Anti-inflammation delays SCC development and prolongs survival of Tgfbr2fspKO mice.
(A) Kaplan survival curve of Tgfbr2fspKO mice treated with Celecoxib or housed in Helicobacter free environment. The pups received the Celecoxib starting the second week after birth, together with the nursing mother mouse in the same cage. The treatment continued after weaning. (B) Celecoxib-treated and Helicobacter free Tgfbr2fspKO mice displayed decreased hyperplasia and CD45+ infiltration by histopathology compared to untreated Tgfbr2fspKO mice. Forestomach samples from 5 week mice stained for H&E and CD45. Scale bar: 20 µm. (C) Western blot analysis of iNOS, COX2, p65, γ-H2AX and p53 in forestomach samples from Tgfbr2fspKO mice treated with Celecoxib or L-NAME. (D) IFN-γ and TNF-Bioplex assay with forestomach samples from Tgfbr2fspKO and Tgfbr2fspKO mice treated with Celecoxib or housed in Helicobacter free condition. Error bars represent SD. **P<0.01 and ***P<0.001. (E) Reduced production of 8-oxo-dG in Tgfbr2fspKO mice treated with Celecoxib or in Helicobacter free conditions. Scale bar: 20 µm.
Figure 5
Figure 5. Anti-inflammation decreases promoter methylation and restores p21 expression.
(A) Decreased CpG 16 methylation of p21 promoter from forestomach samples of Tgfbr2fspKO mice treated with Celecoxib (n = 3). Data is represented as mean ± SD. (B) Real time RT-PCR of p21 expression in laser captured epithelial and stromal cells from Tgfbr2flox/flox and Tgfbr2fspKO mice, treated with Celecoxib. (C) Western blot of p21 in forestomach samples of Tgfbr2fspKO mice treated with Celecoxib (n = 2) compared to untreated Tgfbr2fspKO mice (n = 1) and floxed control mice (n = 2). (D) Celecoxib treatment of Tgfbr2fspKO mice did not restore the expression of p15 in epithelial layers of forestomach tumors (Western blot). *P<0.05 and **P<0.01.
Figure 6
Figure 6. Reduced expression of TβRII in FSP1+ stromal cells, evident inflammation and DNA damage in human ESCC.
(A) Immunofluorescence staining of FSP1+ cells (green) and TβRII (red) in human ESCC and adjacent normal esophagus (left panels). Quantitative data are listed on the right panels. The % FSP-1+ is the FSP1+ cells out of all the cells in one field using Image J software. The % FSP-1+TBRII+ cells are the double positive cells in all FSP+ single positive cells. Three different fields were evaluated, and the average was obtained and shown. Scale bar: 20 µm. Error bars represent SD. **P<0.01. (B) Down-regulation of TβRII in tumor-associated stroma compared to the adjacent normal in a dataset of breast carcinoma. Log2 median-centered intensity RNA expression values were downloaded from Oncomine mRNA dataset Ma 4 Breast, used to generate a dot plot in GraphPad Prism 5.0 and analyzed by two-tailed, paired t-test (right panel). (C) Immunofluorescence staining of p65, iNOS, and 8-oxo-dG in human ESCC. Representative images are shown. Scale bar: 50 µm. Str: Stroma; Epi: epithelia. (D) Significant up-regulation of γ-H2AX mRNA in ESCC compared to normal adjacent tissue (NAT). Data from two ESCC published studies that feature paired ESCC and NAT mRNA microarray were analyzed (www.oncomine.com). (E) Heat map showing copy number loss of p15 and p16 in ESCC. This data was obtained from the same dataset as in (D) which measure DNA copy number on a SNP microarray platform. Blue depicts copy number loss, compared to no loss (white) in peripheral blood DNA.
Figure 7
Figure 7. Schematic hypothesis for the development of forestomach SCC due to loss of Tgfbr2 in stromal fibroblasts.
(A) Tgfbr2 deletion in FSP1+ fibroblasts results in inflammation and infiltration of CD45+ cells in the microenvironment; (B) Inflammation induces DNA damage characterized by 8-oxo-dG and H2AX production in epithelia; (C) epigenetic silencing of p21 and p16, and genetic loss of p15 and p16 in epithelia; (D) loss of cell cycle control and hyper-proliferation of epithelia, development of SCC.

Comment in

  • Microenvironment: Making connections.
    Seton-Rogers S. Seton-Rogers S. Nat Rev Cancer. 2013 Apr;13(4):222-3. doi: 10.1038/nrc3492. Epub 2013 Mar 14. Nat Rev Cancer. 2013. PMID: 23486240 No abstract available.

References

    1. Bhowmick NA, Chytil A, Plieth D, Gorska AE, Dumont N, et al. (2004) TGF-beta signaling in fibroblasts modulates the oncogenic potential of adjacent epithelia. Science 303: 848–851. - PubMed
    1. Wallace JA, Li F, Leone G, Ostrowski MC (2011) Pten in the breast tumor microenvironment: modeling tumor-stroma coevolution. Cancer Res 71: 1203–1207. - PMC - PubMed
    1. Hill R, Song Y, Cardiff RD, Van Dyke T (2005) Selective evolution of stromal mesenchyme with p53 loss in response to epithelial tumorigenesis. Cell 123: 1001–1011. - PubMed
    1. Trimboli AJ, Cantemir-Stone CZ, Li F, Wallace JA, Merchant A, et al. (2009) Pten in stromal fibroblasts suppresses mammary epithelial tumours. Nature 461: 1084–1091. - PMC - PubMed
    1. Tanwar PS, Zhang L, Roberts DJ, Teixeira JM (2011) Stromal deletion of the APC tumor suppressor in mice triggers development of endometrial cancer. Cancer Res 71: 1584–1596. - PMC - PubMed

Publication types

MeSH terms

Substances