. 2013;9(2):e1003263.
doi: 10.1371/journal.pgen.1003263. Epub 2013 Feb 7.

Regulation of Drosophila metamorphosis by xenobiotic response regulators

Affiliations

Regulation of Drosophila metamorphosis by xenobiotic response regulators

Huai Deng et al. PLoS Genet. 2013.

Abstract

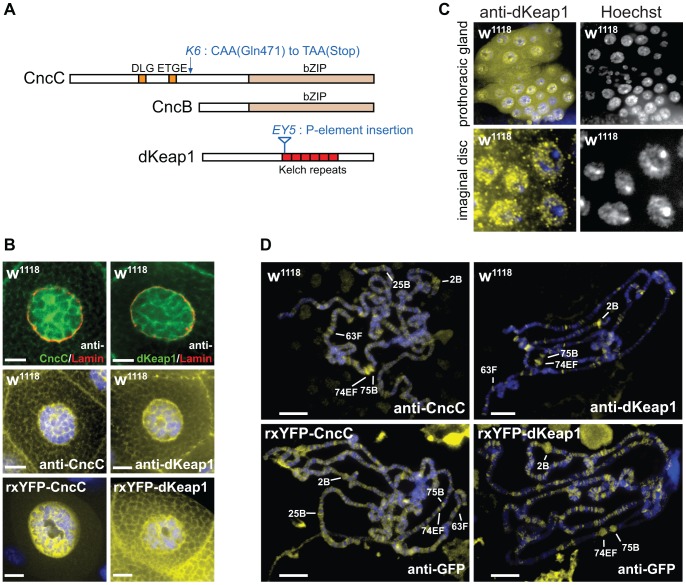
Mammalian Nrf2-Keap1 and the homologous Drosophila CncC-dKeap1 protein complexes regulate both transcriptional responses to xenobiotic compounds as well as native cellular and developmental processes. The relationships between the functions of these proteins in xenobiotic responses and in development were unknown. We investigated the genes regulated by CncC and dKeap1 during development and the signal transduction pathways that modulate their functions. CncC and dKeap1 were enriched within the nuclei in many tissues, in contrast to the reported cytoplasmic localization of Keap1 and Nrf2 in cultured mammalian cells. CncC and dKeap1 occupied ecdysone-regulated early puffs on polytene chromosomes. Depletion of either CncC or dKeap1 in salivary glands selectively reduced early puff gene transcription. CncC and dKeap1 depletion in the prothoracic gland as well as cncC(K6/K6) and dKeap1(EY5/EY5) loss of function mutations in embryos reduced ecdysone-biosynthetic gene transcription. In contrast, dKeap1 depletion and the dKeap1(EY5/EY5) loss of function mutation enhanced xenobiotic response gene transcription in larvae and embryos, respectively. Depletion of CncC or dKeap1 in the prothoracic gland delayed pupation by decreasing larval ecdysteroid levels. CncC depletion suppressed the premature pupation and developmental arrest caused by constitutive Ras signaling in the prothoracic gland; conversely, constitutive Ras signaling altered the loci occupied by CncC on polytene chromosomes and activated transcription of genes at these loci. The effects of CncC and dKeap1 on both ecdysone-biosynthetic and ecdysone-regulated gene transcription, and the roles of CncC in Ras signaling in the prothoracic gland, establish the functions of these proteins in the neuroendocrine axis that coordinates insect metamorphosis.


Conflict of interest statement

The authors have declared that no competing interests exist.

Figures

Figure 1
Figure 1. CncC and dKeap1 subcellular localization and polytene chromosome occupancy.
(A). Conserved sequences and mutations in CncC, CncB and dKeap1. Regions that are conserved between Drosophila and mammalian proteins are shown in color. The locations of the cncK6 and dKeap1EY5 mutations are indicated , . (B). Visualization of the subcellular distributions of CncC and dKeap1 in salivary glands. [Upper panels] Endogenous CncC and dKeap1 distributions in wild type (w1118) salivary glands stained using anti-CncC or anti-dKeap1 (green) and anti-Lamin Dm0 (red) antibodies. [Middle panels] Wild type (w1118) salivary glands were stained with anti-CncC or anti-dKeap1 antibodies (yellow) and Hoechst (blue). [Lower panels] Ectopic CncC and dKeap1 distributions in live salivary glands that expressed rxYFP-CncC and rxYFP-dKeap1, respectively. The intrinsic fluorescence (yellow) was superimposed on Hoechst fluorescence (blue). The salivary glands were isolated from early wandering 3rd instar larvae. The scale bars are 10 µm. (C). Visualization of the localization of endogenous dKeap1 in the prothoracic gland and in imaginal disc cells. Endogenous dKeap1 was visualized by immunostaining using anti-dKeap1 antibodies (yellow) superimposed on Hoechst staining (blue). The separate images are shown to the right of each color image. (D). Visualization of the loci occupied by CncC and dKeap1 on polytene chromosomes. [Upper panels] The loci occupied by endogenous CncC and dKeap1 were visualized on polytene chromosome from wild type larvae (w1118) by staining with anti-CncC and anti-dKeap1 antibodies, respectively. [Lower panels] The loci occupied by ectopic CncC and dKeap1 were visualized on polytene chromosomes from larvae that expressed rxYFP-CncC and rxYFP-dKeap1, respectively, by staining with anti-GFP antibodies. The immunofluorescence (yellow) was superimposed on Hoechst fluorescence (blue). The major ecdysone-regulated early puffs are indicated. The polytene chromosomes were prepared from the salivary glands of early wandering 3rd instar larvae.
Figure 2
Figure 2. Regulation of early puff gene transcription by CncC and dKeap1.
(A). Effects of CncC depletion in the salivary glands on the transcription of ecdysone-regulated genes and xenobiotic response genes. The images show wild type polytene chromosomes stained using anti-CncC antibodies. The levels of the transcripts indicated below the bar graphs were measured in the salivary glands of early wandering 3rd instar larvae. Transcript levels were compared in control larvae [71B-GAL4 (71B>), Sgs3-GAL4 (Sgs3>); open bars] and in larvae that expressed the shRNA targeting CncC under the control of the 71B-GAL4 (71B>cncC-RNAi; solid bars) or the Sgs3-GAL4 (Sgs3>cncC-RNAi; striped bars) driver, as well as in larvae that expressed a different shRNA targeting all Cnc isoforms under the control of the 71B-GAL4 driver (71B>cnc-RNAi; dotted bars). Larvae with different drivers and shRNAs were analyzed in separate experiments under different conditions (see methods). To facilitate comparison, the transcript levels in the lower graph were normalized by the levels of the transcripts in the control larvae. (B). Effects of dKeap1 depletion in the salivary glands on the transcription of ecdysone-regulated genes and xenobiotic response genes. The levels of the transcripts indicated below the bar graphs were measured in the salivary glands of early wandering 3rd instar larvae that expressed the shRNA targeting dKeap1 under the control of the Sgs3-GAL4 driver as described for the lower graph in panel A. The data in panels A and B represent the means and standard deviations from three or four separate experiments each (*, p<0.05). The corresponding loci are indicated in parentheses below the lower graph.
Figure 3
Figure 3. Regulation of ecdysone biosynthetic gene transcription by CncC and dKeap1.
(A). Effects of CncC and dKeap1 depletion in the prothoracic gland on ecdysone biosynthetic gene transcription. [Upper graph] The transcripts indicated below the bars were measured in the brain complexes from early wandering 3rd instar larvae that expressed the shRNA targeting CncC under the control of the 5015-GAL4 (5015>cncC-RNAi, striped bar) or the phm-GAL4 (phm>cncC-RNAi, solid bar) driver, and from larvae that lacked a GAL4 driver (cncC-RNAi, open bar). To facilitate comparison, the transcript levels were normalized by the levels of the transcripts in control larvae (5015>, phm> and w1118). The data represent the means and standard deviations of the ratios of transcript levels between larvae that expressed the cncC-RNAi shRNA constructs and the corresponding control larvae from two independent experiments (*, p<0.05). [Lower graphs] The transcripts indicated above the graphs were measured in the brain complexes from early wandering 3rd instar larvae that expressed the shRNA targeting dKeap1 under the control of the phm-GAL4 (phm>cncC-RNAi, solid bar) driver, and from control larvae (phm>, open bar). The transcript levels were normalized by the levels of Rp49 transcripts divided by 100 and represent the means and standard deviations from two separate experiments (*, p<0.05). (B). Effects of CncC and dKeap1 loss of function mutations on ecdysone biosynthetic gene and xenobiotic response gene transcription in late embryos. The transcripts indicated between the graphs were measured in heterozygous (cncK6/+ or dKeap1EY5/+, open bar) and homozygous (cncK6/K6 or dKeap1EY5/EY5, solid bar) stage 14–16 embryos. The transcript levels were normalized by the levels of Rp49 transcripts divided by 1000 and represent the means and standard deviations from two separate experiments (*, p<0.05). (C). Effects of CncC depletion on PG morphology and Sad protein expression. The brain complexes of control larvae (5015>) and larvae that expressed the shRNA targeting CncC in the PG (5015>cncC-RNAi) were stained using anti-Sad (red) and Hoechst (blue). The ratio of Sad immunostaining in the PG relative to the brain is plotted in the graph to the right of the images (*, p<0.05). (D). Analysis of CncC and dKeap1 occupancy at the promoter regions of ecdysone biosynthetic genes in late embryos. Chromatin isolated from stage 14–16 embryos was precipitated using anti-CncC (solid bars), anti-dKeap1 (striped bars), and pre-immune (open bars) sera. The promoter regions of the genes indicated below the bars were quantified using qPCR. gstD1 was used as a positive control and Rp49, Actn3 and Gapdh1 were used as negative controls. The data represent the mean values and standard deviations of replicate qPCR reactions, and are representative of two experiments using independently prepared embryos.
Figure 4
Figure 4. Effects of CncC and dKeap1 depletion on the time of pupation, pupal size, and ecdysteroid levels.
(A). Effects of expression of the shRNA targeting CncC in the PG on the time of pupation. The proportion of larvae that had formed pupae was plotted as a function of the time after 3rd instar ecdysis for control larvae (phm> or 5015>, black; cncC-RNAi, purple), for larvae that expressed the shRNA targeting CncC (phm>cncC-RNAi, green; 5015>cncC-RNAi, dark green), as well as for larvae that expressed a different shRNA targeting all Cnc isoforms (phm>cnc-RNAi, cyan) in the PG. Pupation by the larvae the expressed the shRNA targeting CncC was also examined when the food was supplemented with 0.5 mg/ml 20E (phm>cncC-RNAi+20E, red). The data in the different graphs were obtained from separate experiments and represent the means and standard deviations from two to four repeats using 20–30 larvae in each. (B). Effects of expression of the shRNA targeting CncC in PG on the sizes of pupae. The lengths of the pupae formed by control larvae (phm>) and larvae that expressed the shRNA targeting CncC in the PG (phm>cncC-RNAi) were measured. The data represent the mean and standard deviation of 30 pupae of each genotype (*, p<0.001). (C). Effects of expression of the shRNA targeting CncC in the PG on 20-hydroxyecdysone (20E) levels. The levels of 20E in larvae and white pre-pupae (WPP, open symbols) were measured in control (phm>, black) and transgenic Drosophila that expressed the shRNA targeting CncC in the PG (phm>cncC-RNAi, green). The 20E level at each time point was measured in 10 larvae or pre-pupae. (D). Effects of expression of the shRNA targeting dKeap1 in the PG on the time of pupation. The proportion of larvae that had formed pupae was plotted as a function of the time after hatching for control larvae (phm>, black) and for larvae that expressed the shRNA targeting dKeap1 (phm>dKeap1-RNAi, orange) in the PG. The data represent the means and standard deviations from four separate experiments using 20–30 larvae in each. The time of pupation was measured after hatching since it was more difficult to obtain a sufficient number of larvae synchronized at 3rd instar ecdysis. Based on observation of a small number of larvae (>10), the time between 3rd instar ecdysis and pupation was delayed by about 3 days upon dKeap1 depletion in the PG. The delay in pupation was therefore primarily due to extension of the 3rd instar larval stage. (E). Effects of expression of the shRNA targeting dKeap1 in the PG on the sizes of pupae. The lengths of the pupae formed by control larvae (phm>) and larvae that expressed the shRNA targeting dKeap1 in the PG (phm>dKeap1-RNAi) were measured. The data represent the mean and standard deviation of 20 pupae of each genotype (*, p<0.001).
Figure 5
Figure 5. Interrelationships between Ras signaling and CncC functions.
(A). Effects of CncC depletion on the time of pupation by larvae that expressed RasV12 in the PG. The proportion of larvae that had formed pupae was plotted as a function of the time after hatching for control larvae (phm>, black), larvae that expressed either RasV12 alone (phm>rasV12, red) or RasV12 together with the shRNA targeting CncC (phm>rasV12, cncC-RNAi, green) in the PG. The data represent the means and standard deviations from three repeats using 20–30 larvae in each. (B). Effects of CncC depletion on the sizes of pupae formed by larvae that expressed RasV12 in the PG. The lengths of pupae formed by the larvae described in part A were measured. The data represent the means and standard deviations of 30 pupae of each genotype (*, p<0.001). (C). Effects of CncC depletion and RasV12 expression in the PG on pupal development. The terminal stage of development was recorded for pupae formed by larvae that expressed either the shRNA targeting CncC alone (5015>cncC-RNAi), RasV12 alone (5015>rasV12), or RasV12 in combination with the shRNA targeting CncC (5015>rasV12, cncC-RNAi) in the PG. The proportion of pupae that arrested at early (P1–P9, open bar) and late (P10–P15, striped bar) pupal stages and that eclosed (adult, solid bar) are indicated (images shown on the right). Early and late stage pupae were distinguished by the absence or presence of red eye pigment (red arrow) and dark wings (blue arrow). Approximately 100 animals of each genotype were scored. (D). Effects of RasV12 expression in salivary glands on CncC occupancy on polytene chromosomes. Polytene chromosomes from control larvae (Sgs3>) and larvae that expressed RasV12 (Sgs3>rasV12) were stained using anti-CncC antibody. Selected loci whose occupancy by CncC changed upon RasV12 expression are labeled. (E). Effects of RasV12 and CncC fusion or CncC-RNAi expression in salivary glands on transcription of genes whose occupancy was affected by RasV12 expression and of control xenobiotic response genes. The levels of the transcripts indicated above the graphs were measured in salivary glands that expressed the proteins or the shRNA indicated. All transcript levels were normalized by the level of Rp49 transcripts. The data represent the means and standard deviations from two separate experiments (*, p<0.05).
Figure 6
Figure 6. Model for the regulation of the onset of metamorphosis by CncC and dKeap1.
The roles of Ras signaling and ecdysone biosynthesis in the control of metamorphosis were previously established , , . Our results show that CncC and dKeap1 regulate ecdysone biosynthetic genes and that CncC links Ras signaling to ecdysone biosynthetic gene transcription in the PG. The consequent modulation of ecdysone biosynthesis can regulate the onset of metamorphosis. CncC and dKeap1 also regulate the transcription of ecdysone-inducible genes in the salivary gland. We propose that CncC and dKeap1 coordinate the developmental programs that regulate the onset of metamorphosis by controlling both ecdysone biosynthetic and response genes in different tissues.

Similar articles

Cited by

References

    1. Taguchi K, Motohashi H, Yamamoto M (2011) Molecular mechanisms of the Keap1-Nrf2 pathway in stress response and cancer evolution. Genes Cells 16: 123–140. - PubMed
    1. Misra JR, Horner MA, Lam G, Thummel CS (2011) Transcriptional regulation of xenobiotic detoxification in Drosophila. Genes Dev 25: 1796–1806. - PMC - PubMed
    1. Sykiotis GP, Bohmann D (2008) Keap1/Nrf2 signaling regulates oxidative stress tolerance and lifespan in Drosophila. Dev Cell 14: 76–85. - PMC - PubMed
    1. Slocum SL, Kensler TW (2011) Nrf2: control of sensitivity to carcinogens. Arch Toxicol 85: 273–284. - PubMed
    1. Padmanabhan B, Tong KI, Ohta T, Nakamura Y, Scharlock M, et al. (2006) Structural basis for defects of Keap1 activity provoked by its point mutations in lung cancer. Mol Cell 21: 689–700. - PubMed

Publication types

MeSH terms

LinkOut - more resources