

A meta-analysis of thyroid-related traits reveals novel loci and gender-specific differences in the regulation of thyroid function
- PMID: 23408906
- PMCID: PMC3567175
- DOI: 10.1371/journal.pgen.1003266
A meta-analysis of thyroid-related traits reveals novel loci and gender-specific differences in the regulation of thyroid function
Abstract
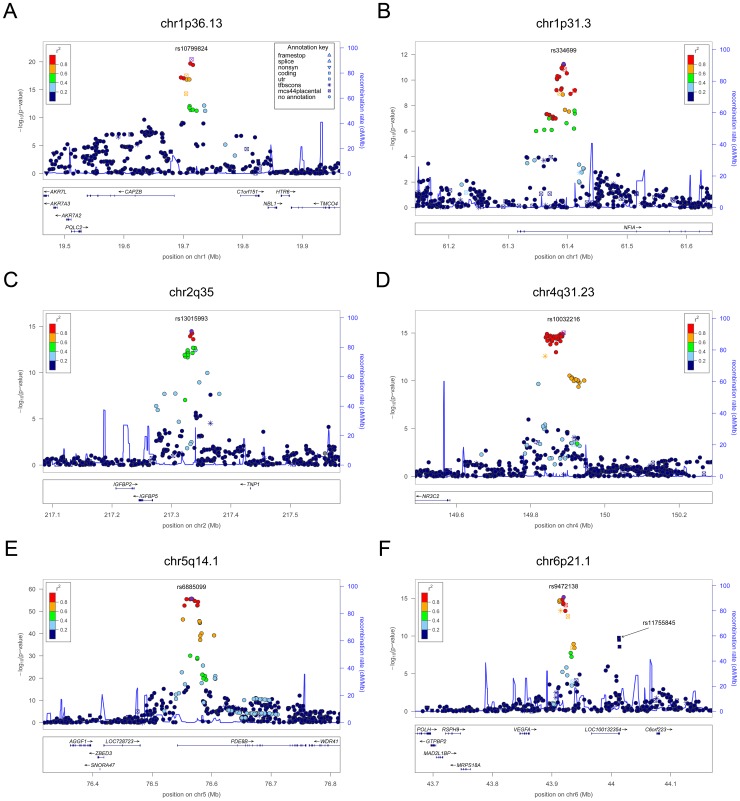
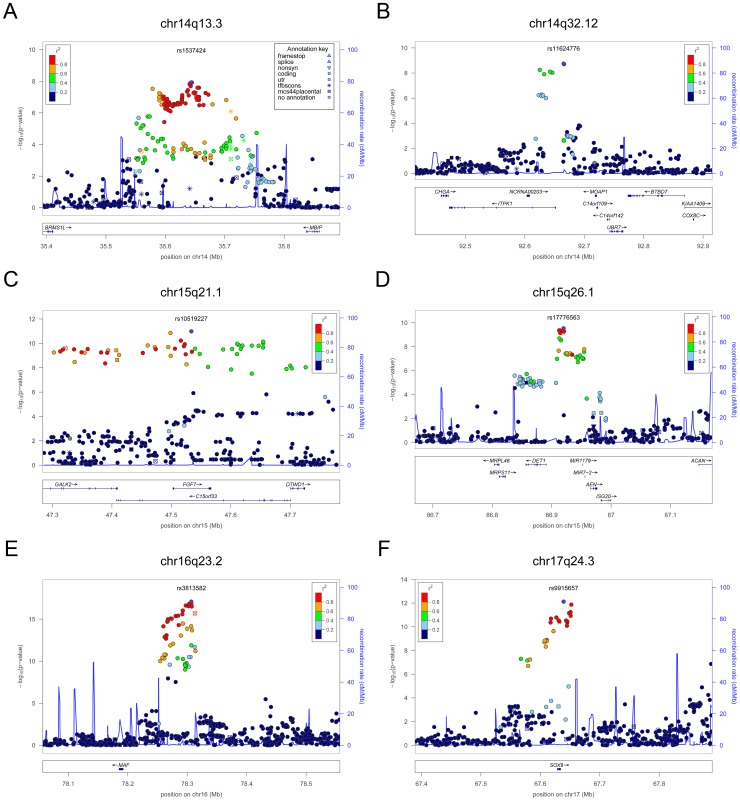
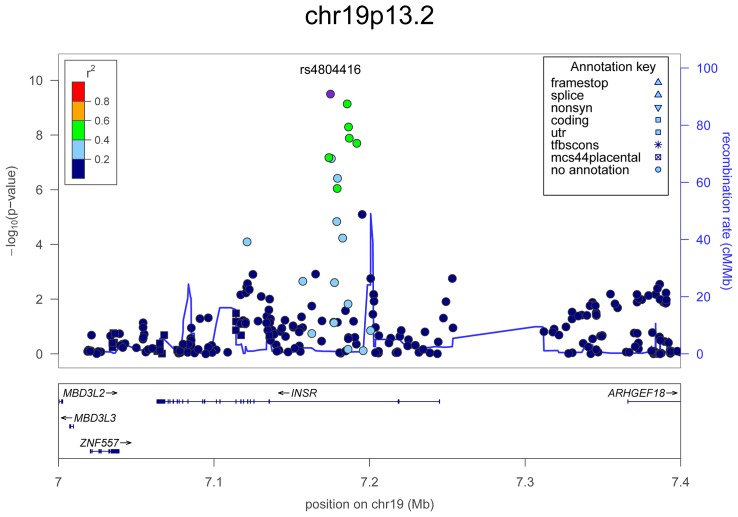
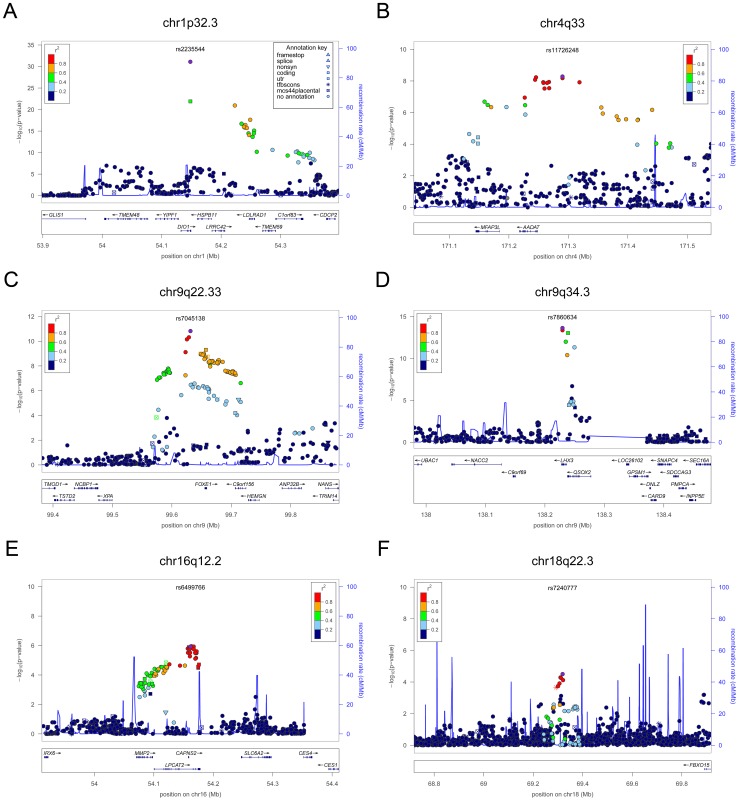
Thyroid hormone is essential for normal metabolism and development, and overt abnormalities in thyroid function lead to common endocrine disorders affecting approximately 10% of individuals over their life span. In addition, even mild alterations in thyroid function are associated with weight changes, atrial fibrillation, osteoporosis, and psychiatric disorders. To identify novel variants underlying thyroid function, we performed a large meta-analysis of genome-wide association studies for serum levels of the highly heritable thyroid function markers TSH and FT4, in up to 26,420 and 17,520 euthyroid subjects, respectively. Here we report 26 independent associations, including several novel loci for TSH (PDE10A, VEGFA, IGFBP5, NFIA, SOX9, PRDM11, FGF7, INSR, ABO, MIR1179, NRG1, MBIP, ITPK1, SASH1, GLIS3) and FT4 (LHX3, FOXE1, AADAT, NETO1/FBXO15, LPCAT2/CAPNS2). Notably, only limited overlap was detected between TSH and FT4 associated signals, in spite of the feedback regulation of their circulating levels by the hypothalamic-pituitary-thyroid axis. Five of the reported loci (PDE8B, PDE10A, MAF/LOC440389, NETO1/FBXO15, and LPCAT2/CAPNS2) show strong gender-specific differences, which offer clues for the known sexual dimorphism in thyroid function and related pathologies. Importantly, the TSH-associated loci contribute not only to variation within the normal range, but also to TSH values outside the reference range, suggesting that they may be involved in thyroid dysfunction. Overall, our findings explain, respectively, 5.64% and 2.30% of total TSH and FT4 trait variance, and they improve the current knowledge of the regulation of hypothalamic-pituitary-thyroid axis function and the consequences of genetic variation for hypo- or hyperthyroidism.
Conflict of interest statement
The authors have declared that no competing interests exist.
Figures

References
-
- Toft AD (2001) Clinical practice. Subclinical hyperthyroidism. N Engl J Med 345: 512–516. - PubMed
-
- Cooper DS (2001) Clinical practice. Subclinical hypothyroidism. N Engl J Med 345: 260–265. - PubMed
-
- Fernandez-Real JM, Lopez-Bermejo A, Castro A, Casamitjana R, Ricart W (2006) Thyroid function is intrinsically linked to insulin sensitivity and endothelium-dependent vasodilation in healthy euthyroid subjects. J Clin Endocrinol Metab 91: 3337–3343. - PubMed
-
- Biondi B, Cooper DS (2008) The clinical significance of subclinical thyroid dysfunction. Endocr Rev 29: 76–131. - PubMed
-
- Chiamolera MI, Wondisford FE (2009) Minireview: Thyrotropin-releasing hormone and the thyroid hormone feedback mechanism. Endocrinology 150: 1091–1096. - PubMed
Publication types
MeSH terms
Substances
Grants and funding
- UL1TR000124/TR/NCATS NIH HHS/United States
- N01-HC-85081/HC/NHLBI NIH HHS/United States
- DH_/Department of Health/United Kingdom
- N01-HC-85082/HC/NHLBI NIH HHS/United States
- N01 HC055222/HL/NHLBI NIH HHS/United States
- R01 AG020098/AG/NIA NIH HHS/United States
- DK063491/DK/NIDDK NIH HHS/United States
- ETM/55/CSO_/Chief Scientist Office/United Kingdom
- N02-HL-6-4278/HL/NHLBI NIH HHS/United States
- N01-HC-25195/HC/NHLBI NIH HHS/United States
- WT091310,085541/Z/08/Z/WT_/Wellcome Trust/United Kingdom
- N01-HC-85085/HC/NHLBI NIH HHS/United States
- R01 AG015928/AG/NIA NIH HHS/United States
- U01 HL080295/HL/NHLBI NIH HHS/United States
- U01 HL72515/HL/NHLBI NIH HHS/United States
- N01-AG-1-2109/AG/NIA NIH HHS/United States
- HL105756/HL/NHLBI NIH HHS/United States
- R01 MD009164/MD/NIMHD NIH HHS/United States
- N01 HC015103/HC/NHLBI NIH HHS/United States
- N01 HC085086/HL/NHLBI NIH HHS/United States
- 263 MD 821336/MD/NIMHD NIH HHS/United States
- AG-15928/AG/NIA NIH HHS/United States
- R56 AG020098/AG/NIA NIH HHS/United States
- CAPMC/ CIHR/Canada
- R01 AG18728/AG/NIA NIH HHS/United States
- R01 HL087652/HL/NHLBI NIH HHS/United States
- AG-20098/AG/NIA NIH HHS/United States
- M01 RR 16500/RR/NCRR NIH HHS/United States
- HL087652/HL/NHLBI NIH HHS/United States
- UL1 TR000124/TR/NCATS NIH HHS/United States
- MR/K026992/1/MRC_/Medical Research Council/United Kingdom
- N01-HC-85086/HC/NHLBI NIH HHS/United States
- R01 HL105756/HL/NHLBI NIH HHS/United States
- AG-027058/AG/NIA NIH HHS/United States
- P30 DK063491/DK/NIDDK NIH HHS/United States
- N01-HC-35129/HC/NHLBI NIH HHS/United States
- WT089062/WT_/Wellcome Trust/United Kingdom
- N01 HC-55222/HC/NHLBI NIH HHS/United States
- HHSN268201200036C/HL/NHLBI NIH HHS/United States
- N01 HC025195/HL/NHLBI NIH HHS/United States
- M01 RR 000052/RR/NCRR NIH HHS/United States
- M01 RR000052/RR/NCRR NIH HHS/United States
- N01 HC085079/HL/NHLBI NIH HHS/United States
- N01-HC-85083/HC/NHLBI NIH HHS/United States
- N01-HC-75150/HC/NHLBI NIH HHS/United States
- N01-HC-85080/HC/NHLBI NIH HHS/United States
- N01 HC-15103/HC/NHLBI NIH HHS/United States
- U01 HL072515/HL/NHLBI NIH HHS/United States
- R01 HL080295/HL/NHLBI NIH HHS/United States
- M01 RR016500/RR/NCRR NIH HHS/United States
- ImNIH/Intramural NIH HHS/United States
- N01-HC-45133/HC/NHLBI NIH HHS/United States
- G0700704/MRC_/Medical Research Council/United Kingdom
- N01-HC-85079/HC/NHLBI NIH HHS/United States
- WT_/Wellcome Trust/United Kingdom
- HL080295/HL/NHLBI NIH HHS/United States
- BB/F019394/1/BB_/Biotechnology and Biological Sciences Research Council/United Kingdom
- N01-HC-85239/HC/NHLBI NIH HHS/United States
- AG-023629/AG/NIA NIH HHS/United States
- N01 HC075150/HL/NHLBI NIH HHS/United States
- R01 AG023629/AG/NIA NIH HHS/United States
- R01 AG027058/AG/NIA NIH HHS/United States
- 263 MD 9164/MD/NIMHD NIH HHS/United States
- N01 HC045133/HC/NHLBI NIH HHS/United States
- R01 AG018728/AG/NIA NIH HHS/United States
- N01 HC035129/HC/NHLBI NIH HHS/United States
- R56 AG023629/AG/NIA NIH HHS/United States
- N01-HC-85084/HC/NHLBI NIH HHS/United States
- WT098051/WT_/Wellcome Trust/United Kingdom
LinkOut - more resources
Full Text Sources
Other Literature Sources
Medical
Research Materials
Miscellaneous
