. 2013;9(2):e1003279.
doi: 10.1371/journal.pgen.1003279. Epub 2013 Feb 7.

Autophagy induction is a Tor- and Tp53-independent cell survival response in a zebrafish model of disrupted ribosome biogenesis

Affiliations

Autophagy induction is a Tor- and Tp53-independent cell survival response in a zebrafish model of disrupted ribosome biogenesis

Yeliz Boglev et al. PLoS Genet. 2013.

Abstract

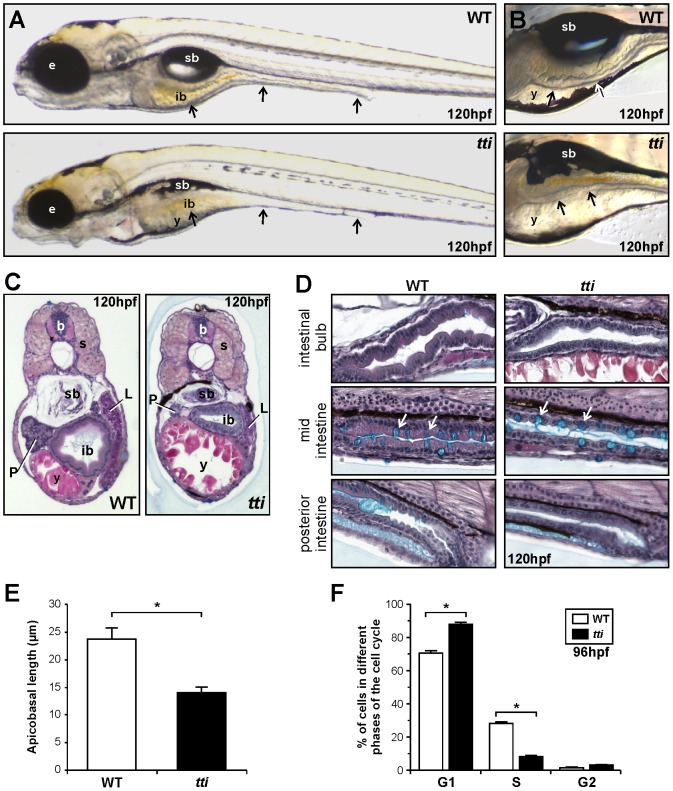
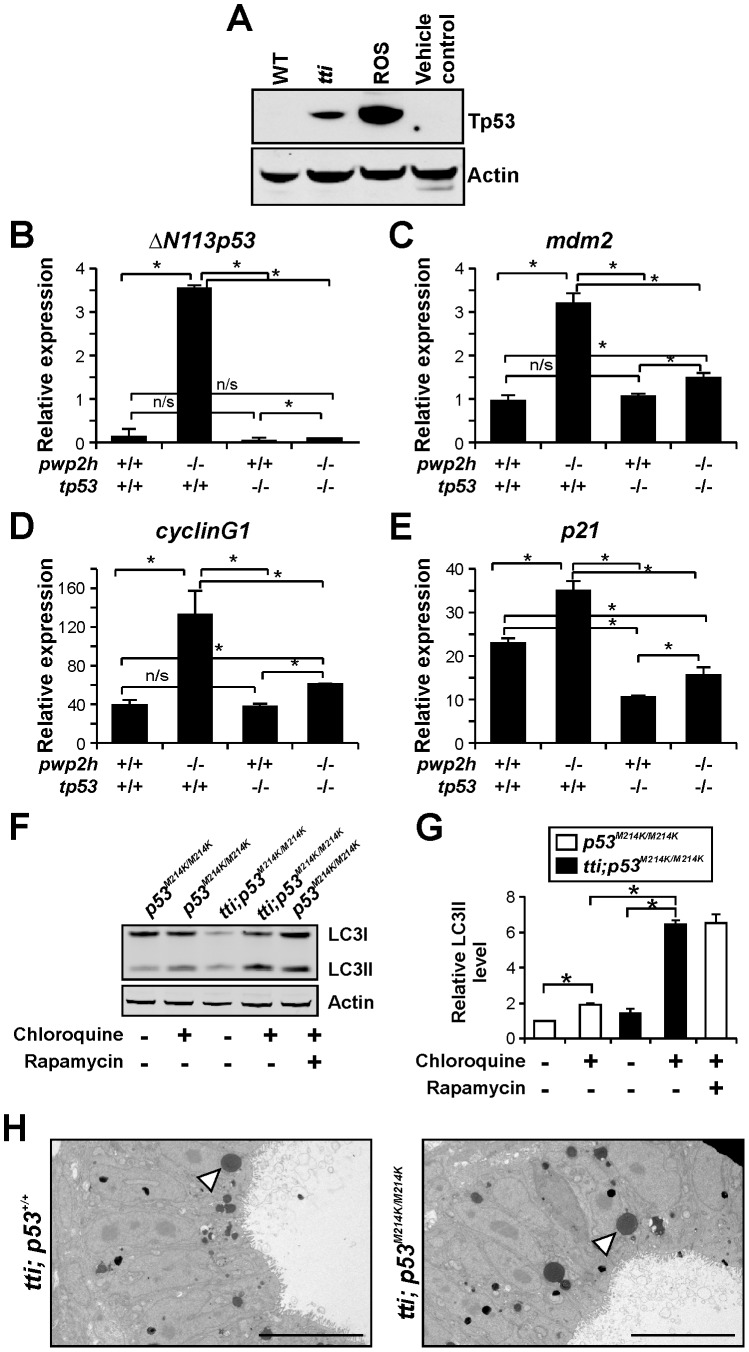
Ribosome biogenesis underpins cell growth and division. Disruptions in ribosome biogenesis and translation initiation are deleterious to development and underlie a spectrum of diseases known collectively as ribosomopathies. Here, we describe a novel zebrafish mutant, titania (tti(s450)), which harbours a recessive lethal mutation in pwp2h, a gene encoding a protein component of the small subunit processome. The biochemical impacts of this lesion are decreased production of mature 18S rRNA molecules, activation of Tp53, and impaired ribosome biogenesis. In tti(s450), the growth of the endodermal organs, eyes, brain, and craniofacial structures is severely arrested and autophagy is up-regulated, allowing intestinal epithelial cells to evade cell death. Inhibiting autophagy in tti(s450) larvae markedly reduces their lifespan. Somewhat surprisingly, autophagy induction in tti(s450) larvae is independent of the state of the Tor pathway and proceeds unabated in Tp53-mutant larvae. These data demonstrate that autophagy is a survival mechanism invoked in response to ribosomal stress. This response may be of relevance to therapeutic strategies aimed at killing cancer cells by targeting ribosome biogenesis. In certain contexts, these treatments may promote autophagy and contribute to cancer cells evading cell death.


Conflict of interest statement

The authors have declared that no competing interests exist.

Figures

Figure 1
Figure 1. The ttis450 phenotype encompasses craniofacial defects, smaller endodermal organs, and microphthalmia.
(A, B) Differential interference contrast (DIC) images of WT and ttis450 larvae at 120 hpf. (A) The black arrows indicate, from left to right, the 3 regions of the intestine: the intestinal bulb, mid-intestine and posterior intestine. (B) The intestinal epithelium in WT larvae is extensively folded (upper panel) and is thinner and unfolded in ttis450 larvae (bottom panel). In ttis450, yolk resorption is incomplete and the swim bladder does not inflate. Microphthalmia is evident and the head is slightly smaller and misshapen. (C, D) Transverse (C) and sagittal (D) histological sections of WT and ttis450 larvae at 120 hpf stained with alcian blue periodic acid-Schiff reagent. The anterior part of the intestine (intestinal bulb) is expanded and the epithelium is elaborated into folds in WT larvae (C, left panel). In ttis450 the intestinal bulb, liver and pancreas are smaller than in WT and the epithelium is relatively thin and flat (C, right panel). (D) The intestinal epithelial cells of the entire intestinal tract are columnar in shape in WT larvae (left panels) and are cuboidal in ttis450 (right panels). Goblet cells containing acidic mucins (turquoise staining) are present in approximately equal numbers (white arrows) in the WT and ttis450 mid-intestine. sb, swim bladder; b, brain; ib, intestinal bulb; y, yolk; e, eye; s, somite; P, pancreas; L, liver; (E) The average apicobasal length of the IECs in the intestinal bulb region of ttis450 larvae at 120 hpf is approximately half that of WT IECs. Measurements were performed on 10 cells in 3 independent sections. (F) Fluorescent activated cell sorting analysis of the cell cycle in cells derived from the GFP-positive, endoderm derived organs (liver, pancreas, intestine) of tti s450 and WT larvae on the gutGFP background at 96 hpf. Data are represented as the mean +/− SD (n = 3), *p<0.05.
Figure 2
Figure 2. Positional cloning reveals that pwp2h is the mutated gene in ttis450.
(A) Physical map of chromosome 1 in the region encompassing the ttis450 locus. Analysis of recombinants from 7376 meioses narrowed the genetic interval containing the mutation to a region flanked by 2 BACs (green boxes) and encompassed by 2 scaffolds zv945445 and zv945446 (blue bars) containing 5 genes (arrows). (B) Schematic representation of the pwp2h gene and the location of the sequence variation in intron 9. (C) The nucleotide sequence of pwp2h cDNA from ttis450 larvae contains an A→T transversion. Wholemount in situ hybridization (WISH) reveals the pwp2h mRNA expression pattern from 4–144 hpf in WT larvae (D–L). pwp2h expression is ubiquitous from 4–12 hpf (D–F), restricted to the retina at 24 hpf (G; black arrow) and encompasses the pharyngeal cartilages (black arrowhead), liver (white arrow), intestine (bracket) and pancreas (white arrowhead) at 48 hpf (H), 72 hpf (I) and 96 hpf (J). From 120–144 hpf pwp2h expression is restricted to the pancreas (K–L; white arrowhead). pwp2h expression is barely detectable at 24 hpf (M) and 72 hpf (N) in ttis450 larvae. Staining is absent in the sense control at 72 hpf (O) and at all other time points (data not shown).
Figure 3
Figure 3. ttis450 larvae display defects in ribosome biogenesis.
(A) Northern analysis of RNA isolated from WT and ttis450 larvae at 120 hpf using 5′ETS, ITS1, and ITS2 probes to detect precursor forms of rRNA. Elf1α is a loading control. a–d correspond to the rRNA intermediates depicted in Figure 3B. (B) Schematic diagram showing the rRNA processing pathway in zebrafish . The sites of hybridization of the 5′ETS, ITS1 and ITS2 probes are indicated. (C) Representative E-Bioanalyser analysis of total RNA isolated from WT and ttis450 larvae at 120 hpf demonstrates a reduction in the 18S peak in ttis450 larvae resulting in an elevated 28S/18S rRNA ratio in ttis450 (D). Graphical representation of the experiment shown in C. Data are represented as mean +/− SD (n = 5). (E) Representative polysome fractionation analysis performed on WT and ttis450 larvae at 96 hpf demonstrates reduced levels of 40S ribosomal subunits and 80S monosomes and an increase in free 60S subunits in ttis450 larvae compared to WT. (F) Graphical representation of the experiment shown in E. Data are represented as mean +/− SD (n = 5) *p<0.05.
Figure 4
Figure 4. The intestinal epithelial cells (IECS) in ttis450 larvae contain autophagosome- and autolysome-like structures.
(A–H) Transmission electron micrographs of WT and ttis450 larvae at 96 hpf (A, B), 120 hpf (C–F) and 144 hpf (G, H). Sections are transverse through the yolk in the region of the intestinal bulb. WT IECs demonstrate well-developed apicobasal polarity as evidenced by basally positioned nuclei (n) and the elaboration of microvilli (mv) projecting from the apical surface into the intestinal lumen. Mitochondria (m) are abundant and plasma membranes (pm) are well defined. The intestinal epithelium in ttis450 is highly disorganized, with shorter and relatively sparse apical microvilli compared to WT. Vesicles resembling autophagosomes (white arrowhead in B) are present in the intestinal epithelial cells of ttis450 larvae (B′ [boxed area in B], H″ [boxed area in H]) but not in WT (A, A′ [boxed area in A] and G). At 120 hpf, electron-dense structures, likely to correspond to autolysosomes, are present in ttis450 larvae (white arrowheads in D, D′ [boxed area in D]), but not WT (C, C′ [boxed area in C]). When ttis450 larvae are treated with chloroquine to block the fusion of autophagosomes with lysosomes, the electron-dense structures are no longer apparent at 120 hpf; instead vesicles more typical of autophagosomes are found (white arrowheads in F). The boxed areas in F (F′ and F″) show vesicles containing debris, including one (white arrow in F″), with a clear double membrane. Scale bars = 10 µm (A–H) and 1 µm (all insets).
Figure 5
Figure 5. Comparable autophagic flux in the IECs of ttis450 larvae and WT larvae treated with rapamycin.
(A–F) Transverse sections (200 µm) through the intestinal bulb region of untreated WT (A) and ttis450 (B) larvae at 120 hpf or larvae previously treated for 14 h with rapamycin and/or chloroquine (C–F) stained with rhodamine phalloidin to detect F-actin (red), Hoechst 33342 to detect DNA (blue) and the LC3B antibody to detect LC3II–containing autophagosomes (green puncta). (G) The numbers of autophagosomes are increased in chloroquine-treated WT and ttis450 larvae compared to the corresponding untreated larvae. Chloroquine-treated ttis450 larvae contain significantly more puncta than chloroquine-treated WT larvae and similar numbers to WT larvae treated with rapamycin and chloroquine. Rapamycin and chloroquine-treated ttis450 larvae contain significantly more puncta per IEC than the IECs in chloroquine-treated ttis450 larvae and chloroquine and rapamycin-treated WT larvae. Puncta were counted in 20 cells from 3 independent sections using Metamorph. (H) Representative Western blot analysis of whole cell lysates of WT and ttis450 larvae (96 hpf) previously treated for 14 h with rapamycin (10 µM) and/or chloroquine (2.5 µM) using antibodies to LC3B and Actin (loading control). (I) Graphical representation of the data shown in H and two independent analyses. The LC3II signals were quantitated by densitometry. ttis450 larvae treated with chloroquine contain more LC3II than their chloroquine-treated WT siblings and comparable levels to WT larvae treated with rapamycin and chloroquine. Data are represented as mean +/− SD, *p<0.05.
Figure 6
Figure 6. Disrupting autophagy in ttis450 larvae results in the death of IECs and a reduced lifespan.
(A) Western blot analysis of lysates of ttis450 larvae (72 hpf) that had been injected at the 1–4 cell stage with an antisense morpholino oligonucleotide (MO) targeted to the start codon of atg5 mRNA reveals decreased levels of LC3II compared to untreated and vehicle controls, both in the presence and absence of chloroquine. Data are represented as mean +/− SD, *p<0.05. (B) Survival curve of untreated WT and ttis450 larvae compared to WT and ttis450 larvae that had been injected at the 1–4 cell stage with vehicle or atg5 MO (n>85 larvae per group). The lifespan of WT embryos/larvae is completely unaffected by injection with the atg5 MO since all three groups of WT larvae (untreated, vehicle-treated and atg5 MO-treated) progress normally through the first 10 days of development, when the experiment was terminated. The horizontal line represents untreated WT embryos (maroon squares), vehicle-injected WT embryos (green triangles) and atg5 MO-injected WT embryos (blue triangles). In contrast, ttis450 embryos respond to microinjection of the atg5 MO by impaired survival. Whereas all untreated (yellow diamonds) or vehicle-injected (purple circles) ttis450 larvae are still alive at 7 dpf, all the atg5 MO-injected ttis450 larvae are dead at this time-point (red squares). Indeed, 20% of the atg5 MO-injected ttis450 larvae have already succumbed by 3 dpf. (C–F) TEMs of WT (C) and ttis450 larvae at 120 hpf (D–F), injected at the 1–4 cell stage with the atg5-targeted MO. Inhibiting autophagy in ttis450 larvae results in the appearance of detached and shrunken IECs in the intestinal lumen (black arrow in D, E and F [boxed area in D]) but has no impact on WT IECs (C). Scale bars = 10 µm.
Figure 7
Figure 7. ttis450 larvae exhibit elevated levels of Torc1 activity.
(A) Western blot analysis of RPS6, p-RPS6 and Actin (loading control) in whole cell lysates of WT and ttis450 larvae between 72–120 hpf. (B) Graphical representation of the data shown in A combined with two additional experiments (each bar represents the mean +/− SD, *p<0.05). ttis450 larvae exhibit increased levels of p-RPS6 at 96–120 hpf and decreased levels of total RPS6 between 72–120 hpf compared to WT siblings. (C) Immunohistochemical analysis of transverse sections of ttis450 and WT larvae at 96 hpf reveals robust p-RPS6 expression in the digestive organs. Scale bars = 50 µM. (D) The persistent expression of p-RPS6 expression in ttis450 larvae at 96 hpf compared to WT is due entirely to up-regulated Torc1 activity as shown by the disappearance of the p-RPS6 signal when larvae are pre-treated with rapamycin. (E) Inhibiting the Tor pathway in ttis450 larvae with rapamycin in the presence of chloroquine reduces p-RPS6 expression and at the same time increases autophagic flux as shown by the increase in LC3II level. In the graphical representation of the data, each bar represents the mean +/− SD (n = 3), *p<0.05.
Figure 8
Figure 8. Autophagy in ttis450 larvae is not due to Tp53 activation.
(A) Western blot analysis of Tp53 protein in whole cell lysates of WT (lane 1) and ttis450 (lane 2) larvae at 96 hpf reveals up-regulation of Tp53 expression in ttis450. Larvae treated with roscovotine (ROS; lane 3) to induce Tp53 protein expression or untreated larvae (lane 4) are positive and negative controls, respectively. The Actin signal provides a loading control. (B–E) Relative expression of ΔN113p53 (B), mdm2 (C), cyclinG1 (D) and p21 (E) mRNAs in WT, ttis450 (pwp2h−/−), tp53M214K/M214K (tp53−/−) and ttis450;tp53M214K/M214K (pwp2h−/−;tp53−/−) larvae at 96 hpf (n = 3) demonstrates that the expression of Tp53 target genes is increased in ttis450 compared to WT larvae (compare first 2 bars in all graphs). The Tp53 response is diminished on the tp53M214K/M214K background, as expected (compare 2nd and 4th bars). Data were normalised by reference to Elongation factor alpha (Elf-α) expression. (F) Western blot analysis of LC3 in whole cell lysates of tp53-mutant (tp53M214K/M214K) and ttis450;tp53M214K/M214K larvae at 96 hpf. The elevated autophagic flux in ttis450 larvae due to ribosomal stress is not diminished on a tp53-mutant background. (G) Graphical representation of the data shown in F and two additional experiments. Bars represent the mean +/− SD (n = 3), *p<0.05. (H) Transmission electron micrographs of IECs of ttis450;tp53M214K/M214K larvae at 120 hpf (right panel) reveal electron dense vesicles, resembling autolysosomes (white arrowhead), in comparable numbers to those found in ttis450 larvae with WT Tp53 expression (left panel).

Similar articles

Cited by

References

    1. Warner JR (2001) Nascent ribosomes. Cell 107: 133–136. - PubMed
    1. Doudna JA, Rath VL (2002) Structure and function of the eukaryotic ribosome: the next frontier. Cell 109: 153–156. - PubMed
    1. Jorgensen P, Tyers M (2004) How cells coordinate growth and division. Curr Biol 14: R1014–1027. - PubMed
    1. Narla A, Ebert BL (2010) Ribosomopathies: human disorders of ribosome dysfunction. Blood 115: 3196–3205. - PMC - PubMed
    1. Stumpf CR, Ruggero D (2011) The cancerous translation apparatus. Curr Opin Genet Dev 21: 474–483. - PMC - PubMed

Publication types

MeSH terms

Substances