. 2013;9(2):e1003293.
doi: 10.1371/journal.pgen.1003293. Epub 2013 Feb 7.

Mitotic evolution of Plasmodium falciparum shows a stable core genome but recombination in antigen families

Affiliations

Mitotic evolution of Plasmodium falciparum shows a stable core genome but recombination in antigen families

Selina E R Bopp et al. PLoS Genet. 2013.

Abstract

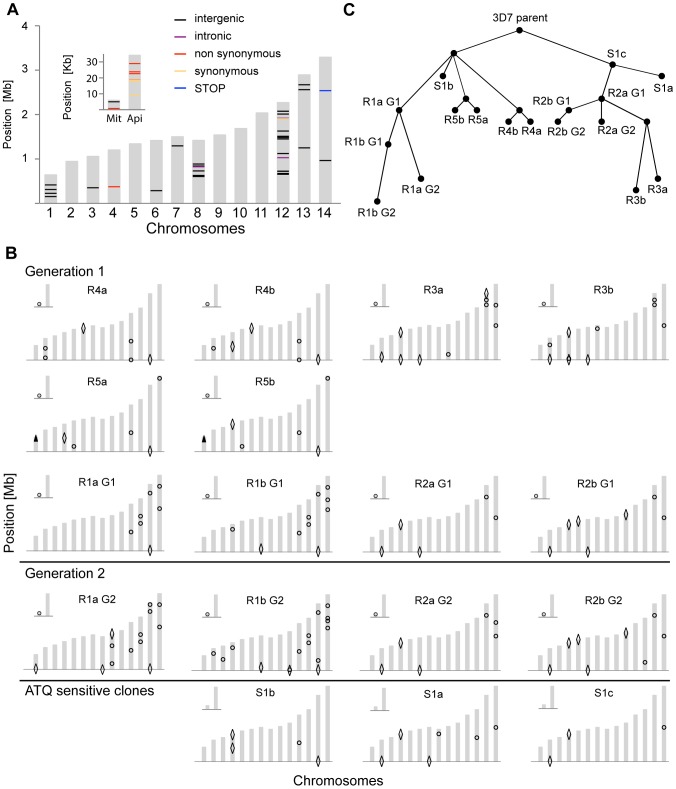
Malaria parasites elude eradication attempts both within the human host and across nations. At the individual level, parasites evade the host immune responses through antigenic variation. At the global level, parasites escape drug pressure through single nucleotide variants and gene copy amplification events conferring drug resistance. Despite their importance to global health, the rates at which these genomic alterations emerge have not been determined. We studied the complete genomes of different Plasmodium falciparum clones that had been propagated asexually over one year in the presence and absence of drug pressure. A combination of whole-genome microarray analysis and next-generation deep resequencing (totaling 14 terabases) revealed a stable core genome with only 38 novel single nucleotide variants appearing in seventeen evolved clones (avg. 5.4 per clone). In clones exposed to atovaquone, we found cytochrome b mutations as well as an amplification event encompassing the P. falciparum multidrug resistance associated protein (mrp1) on chromosome 1. We observed 18 large-scale (>1 kb on average) deletions of telomere-proximal regions encoding multigene families, involved in immune evasion (9.5×10(-6) structural variants per base pair per generation). Six of these deletions were associated with chromosomal crossovers generated during mitosis. We found only minor differences in rates between genetically distinct strains and between parasites cultured in the presence or absence of drug. Using these derived mutation rates for P. falciparum (1.0-9.7×10(-9) mutations per base pair per generation), we can now model the frequency at which drug or immune resistance alleles will emerge under a well-defined set of assumptions. Further, the detection of mitotic recombination events in var gene families illustrates how multigene families can arise and change over time in P. falciparum. These results will help improve our understanding of how P. falciparum evolves to evade control efforts within both the individual hosts and large populations.


Conflict of interest statement

The authors have declared that no competing interests exist.

Figures

Figure 1
Figure 1. Generation of atovaquone (ATQ)-resistant parasites.
A. Selection schematic. An initial parasite clone (3D7) was split into three lines after 55 days, and 20 nM or 50 nM ATQ pressure was applied to lines R4 and R5, respectively. The parental line was kept drug-free. After 24 days, the parental line was split again into four lines, and 2 nM ATQ pressure was applied to three lines (R1, R2, and R3) while line S1 was kept drug free. R2 was again split after 74 days, and 20 nM ATQ was applied repeatedly to line R2b. After the indicated time in culture, all lines were cloned by limiting dilution. Four ATQ-resistant clones were kept in culture (Generation 1 (G1): R1a and b G1 and R2a and b G1) and recloned, resulting in a second generation of clones (Generation 2 (G2): R1a and b G2 and R2a and b G2). The number of days (d) in culture between splits is indicated above each flask. B. ATQ structure and growth inhibition assay. EC50 values for 3D7 parent, the sensitive clones, and the ATQ-resistant clones are the means ± SD of three independent experiments performed in quadruplicate. Statistically significant differences between EC50 values of the parental 3D7 line and the ATQ-resistant clones were calculated by a one-way ANOVA followed by a Dunnett posttest (*, p<0.0001).
Figure 2
Figure 2. Location and evolutionary relationship of genetic changes following long-term culturing of P. falciparum parasites.
Genetic changes in each individual clone were detected by microarray analysis as well as by WGS. A. Genetic differences were detected by WGS between our parental 3D7 clone and the available 3D7 reference genome from PlasmoDB v9.1. The 14 chromosomes are indicated in grey, with their relative length on the y-axis. The mitochondrial (Mit) and apicoplast (Api) genomes are shown in the inset. B. Genetic changes identified by microarray and WGS in each individual clone compared to the parental 3D7 clone. SNVs are indicated with circles, large-scale deletions (>1000 bp) with diamonds, and CNVs with arrowheads. For annotations of genes harboring SNVs or that are part of a structural variant, see Table S2. C. Cladogram showing derived evolutionary relationship in B, computed by a heuristic algorithm to find the tree of minimum complexity starting with the parental clone.
Figure 3
Figure 3. Genomic changes and drug sensitivities of atovaquone (ATQ)-selected clones.
A. Amino acid change (nucleotide change) and codon position in cytochrome b of each clone. B. Location of the amplification event detected on chromosome 1 for R5a (423,658–643,292 bp). The location of the multidrug resistance associated protein 1 (Pfmrp1, PFA0590w) is shown. The log2 ratio of the intensity of each unique probe in R5a relative to that in S1c is plotted and colored by the moving average over a 500-base pair window. C. The EC50 values for four tested drugs are shown for the 3D7 parent, the sensitive clones and the ATQ-resistant clones of the first generation (G1). Statistically significant differences between the EC50 values of the parental 3D7 line and the ATQ-resistant clones were calculated by a one-way ANOVA followed by a Dunnett posttest (*, p<0.0001). EC50 values are means ± SD of three independent experiments performed in quadruplicate.
Figure 4
Figure 4. Detection of deletions in subtelomeric regions by WGS and microarray.
A. Microarray and WGS detection of deletion events. The top two panels show the number of WGS paired-end reads mapping to 16 kb of chromosome 2 for 3D7 and S1a. The third panel shows the same region but with data from the microarray. The log2 ratio of the intensity of each unique probe for S1a relative to 3D7 parent is indicated and colored by the moving average over a 500-base pair window. B. Southern blot analysis. The gDNA of the 3D7 parent and S1a was cut with restriction enzymes HpaI and FspI and analyzed by pulsed field gel electrophoresis using a probe to the rifin gene PFB0015c adjacent to the var gene containing the deletion (schematic on the left, southern blot on the right). Arrows indicate the expected sizes for the fragments of the full-length 3D7 and the truncated S1a var gene (PFB0010w). Stars show nonspecific bands.
Figure 5
Figure 5. Distribution of deleted genes.
Schematic of the location of structural variants detected in individual clones compared to the 3D7 parent. The chromosomal location is indicated on the left, followed by the name of the clone harboring the structural variant (grey box). Dotted boxes indicate regions with low read coverage and absence of unique probes, which mask the exact size of deletions. Different members of gene families are color labeled. Deletions in clones marked with an asterisk are associated with recombination events shown in Figure 6.
Figure 6
Figure 6. Mitotic recombination events detected by WGS.
Paired-end reads next to deletions as well as their read pair mates that mapped to a different chromosome were extracted. De novo assembly of these reads, starting with a single seed that mapped next to the deletion, generated new contigs. Hypothetical scenarios of recombination events that created gene conversions are shown on the left; the sequence alignments of the contigs (center sequences), where the two sequences from different chromosomes joined, are on the right. The chromosomal position (with orientation) and the var gene ID are indicated when applicable.

Similar articles

Cited by

References

    1. WHO (2011) World Malaria Report 2011. http://www.who.int/malaria/world_malaria_report_2010/en/index.html.
    1. O'Brien C, Henrich PP, Passi N, Fidock DA (2011) Recent clinical and molecular insights into emerging artemisinin resistance in Plasmodium falciparum. Curr Opin Infect Dis 24: 570–577. - PMC - PubMed
    1. A Phase 3 Trial of RTS,S/AS01 Malaria Vaccine in African Infants. N Engl J Med - PMC - PubMed
    1. Genton B, Betuela I, Felger I, Al-Yaman F, Anders RF, et al. (2002) A recombinant blood-stage malaria vaccine reduces Plasmodium falciparum density and exerts selective pressure on parasite populations in a phase 1–2b trial in Papua New Guinea. The Journal of Infectious Diseases 185: 820–827. - PubMed
    1. Freitas-Junior LH, Bottius E, Pirrit LA, Deitsch KW, Scheidig C, et al. (2000) Frequent ectopic recombination of virulence factor genes in telomeric chromosome clusters of P. falciparum. Nature 407: 1018–1022. - PubMed

Publication types

MeSH terms