

A three-dimensional human atrial model with fiber orientation. Electrograms and arrhythmic activation patterns relationship
- PMID: 23408928
- PMCID: PMC3569461
- DOI: 10.1371/journal.pone.0050883
A three-dimensional human atrial model with fiber orientation. Electrograms and arrhythmic activation patterns relationship
Abstract
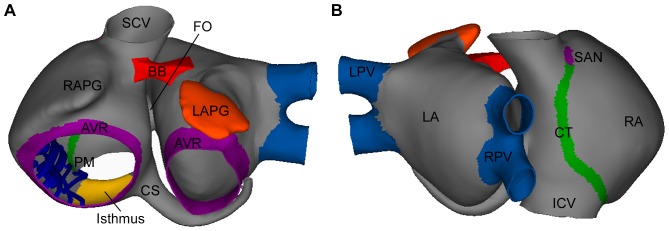
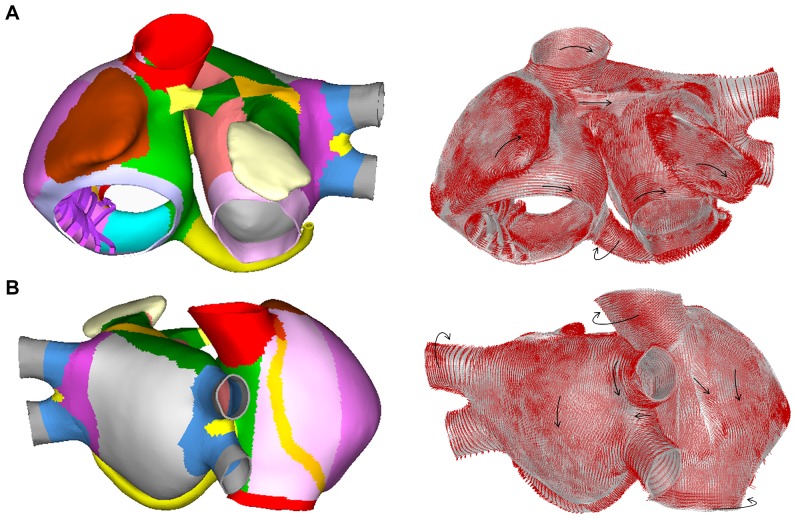
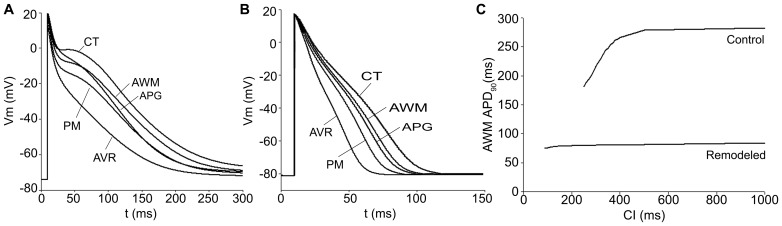
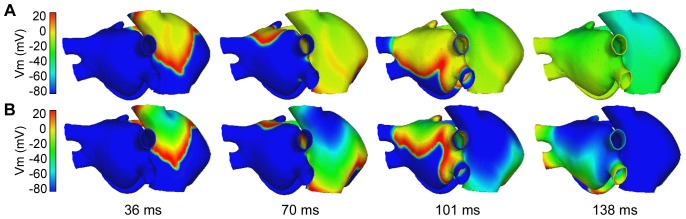
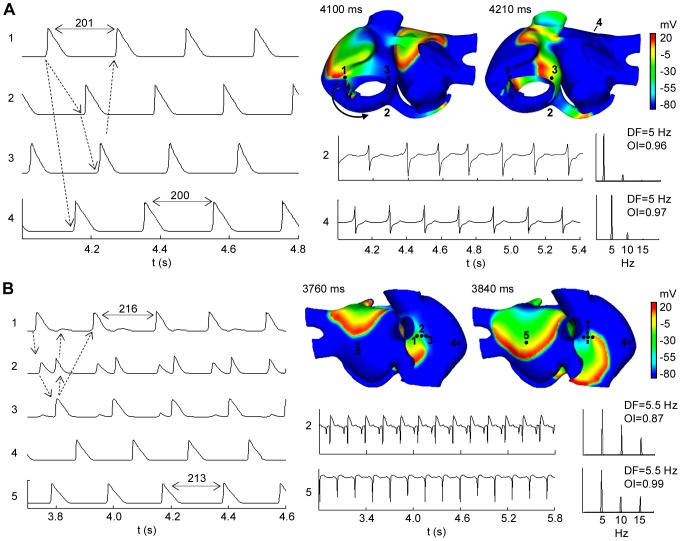
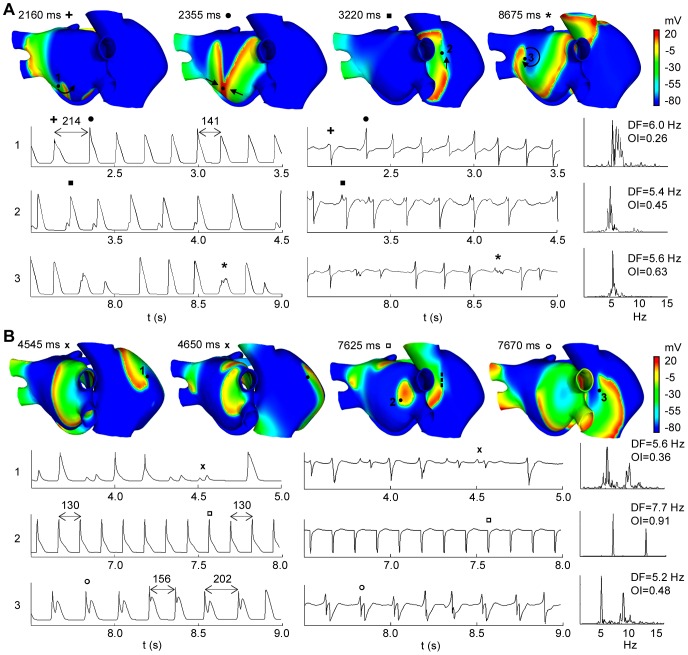
The most common sustained cardiac arrhythmias in humans are atrial tachyarrhythmias, mainly atrial fibrillation. Areas of complex fractionated atrial electrograms and high dominant frequency have been proposed as critical regions for maintaining atrial fibrillation; however, there is a paucity of data on the relationship between the characteristics of electrograms and the propagation pattern underlying them. In this study, a realistic 3D computer model of the human atria has been developed to investigate this relationship. The model includes a realistic geometry with fiber orientation, anisotropic conductivity and electrophysiological heterogeneity. We simulated different tachyarrhythmic episodes applying both transient and continuous ectopic activity. Electrograms and their dominant frequency and organization index values were calculated over the entire atrial surface. Our simulations show electrograms with simple potentials, with little or no cycle length variations, narrow frequency peaks and high organization index values during stable and regular activity as the observed in atrial flutter, atrial tachycardia (except in areas of conduction block) and in areas closer to ectopic activity during focal atrial fibrillation. By contrast, cycle length variations and polymorphic electrograms with single, double and fragmented potentials were observed in areas of irregular and unstable activity during atrial fibrillation episodes. Our results also show: (1) electrograms with potentials without negative deflection related to spiral or curved wavefronts that pass over the recording point and move away, (2) potentials with a much greater proportion of positive deflection than negative in areas of wave collisions, (3) double potentials related with wave fragmentations or blocking lines and (4) fragmented electrograms associated with pivot points. Our model is the first human atrial model with realistic fiber orientation used to investigate the relationship between different atrial arrhythmic propagation patterns and the electrograms observed at more than 43000 points on the atrial surface.
Conflict of interest statement
Figures
References
-
- Wolf P, Benjamin E, Belanger A, Kannel W, Levy D, et al. (1996) Secular trends in the prevalence of atrial fibrillation: The Framingham study. Am Heart J. 113: 790–796. - PubMed
-
- Ho SY, Anderson RH, Sanchez-Quintana D (2002) Atrial structure and fibres: morphologic bases of atrial conduction. Cardiovasc Res. 54(2): 325–336. - PubMed
-
- Lesh MD, Kalman JM, Olgin JE, Ellis WS (1996) The role of atrial anatomy in clinical atrial arrhythmias. J Electrocardiol. 29(1): 101–113. - PubMed
-
- Wilders R, Wagner MB, Golod DA, Kumar R, Wang YG, et al. (2000) Effects of anisotropy on the development of cardiac arrhythmias associated with focal activity. Pflugers Arch. 441: 301–312. - PubMed
-
- Nattel S (2002) New ideas about atrial fibrillation 50 years on. Nature. 415(6868): 219–226. - PubMed
MeSH terms
LinkOut - more resources
Full Text Sources
Other Literature Sources
