

Inaccuracy, uncertainty and the space-time permutation scan statistic
- PMID: 23408930
- PMCID: PMC3567134
- DOI: 10.1371/journal.pone.0052034
Inaccuracy, uncertainty and the space-time permutation scan statistic
Abstract
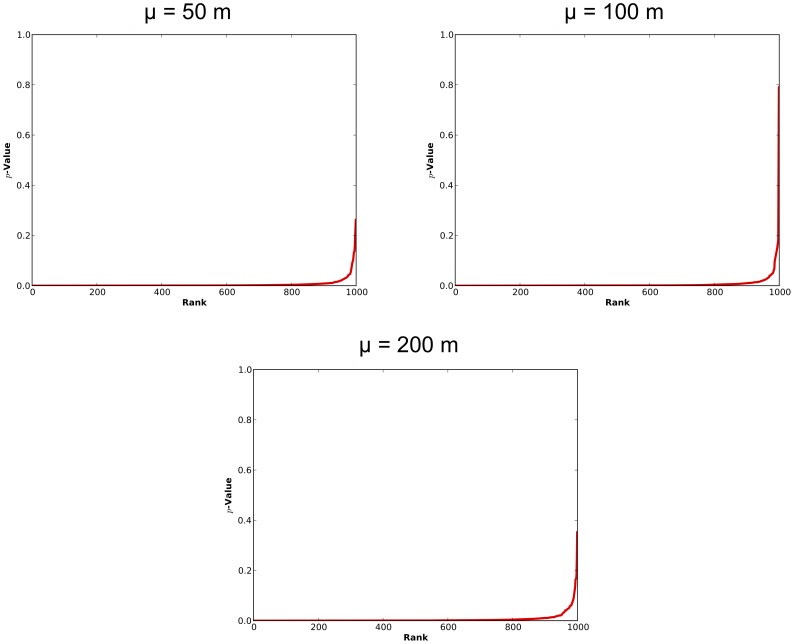
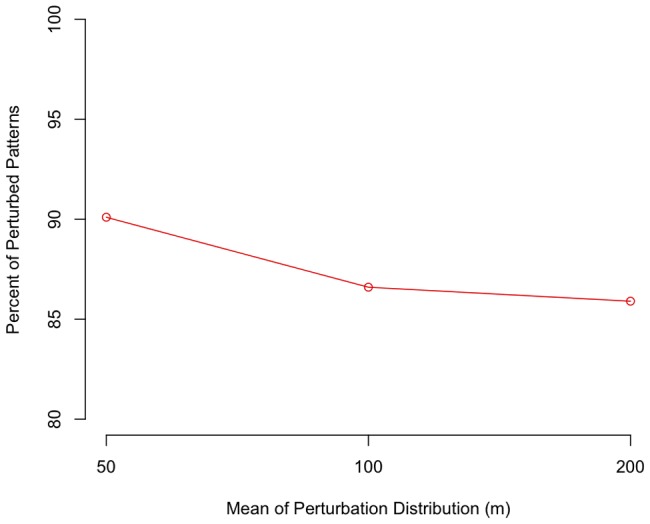
The space-time permutation scan statistic (STPSS) is designed to identify hot (and cool) spots of space-time interaction within patterns of spatio-temporal events. While the method has been adopted widely in practice, there has been little consideration of the effect inaccurate and/or incomplete input data may have on its results. Given the pervasiveness of inaccuracy, uncertainty and incompleteness within spatio-temporal datasets and the popularity of the method, this issue warrants further investigation. Here, a series of simulation experiments using both synthetic and real-world data are carried out to better understand how deficiencies in the spatial and temporal accuracy as well as the completeness of the input data may affect results of the STPSS. The findings, while specific to the parameters employed here, reveal a surprising robustness of the method's results in the face of these deficiencies. As expected, the experiments illustrate that greater degradation of input data quality leads to greater variability in the results. Additionally, they show that weaker signals of space-time interaction are those most affected by the introduced deficiencies. However, in stark contrast to previous investigations into the impact of these input data problems on global tests of space-time interaction, this local metric is revealed to be only minimally affected by the degree of inaccuracy and incompleteness introduced in these experiments.
Conflict of interest statement
Figures
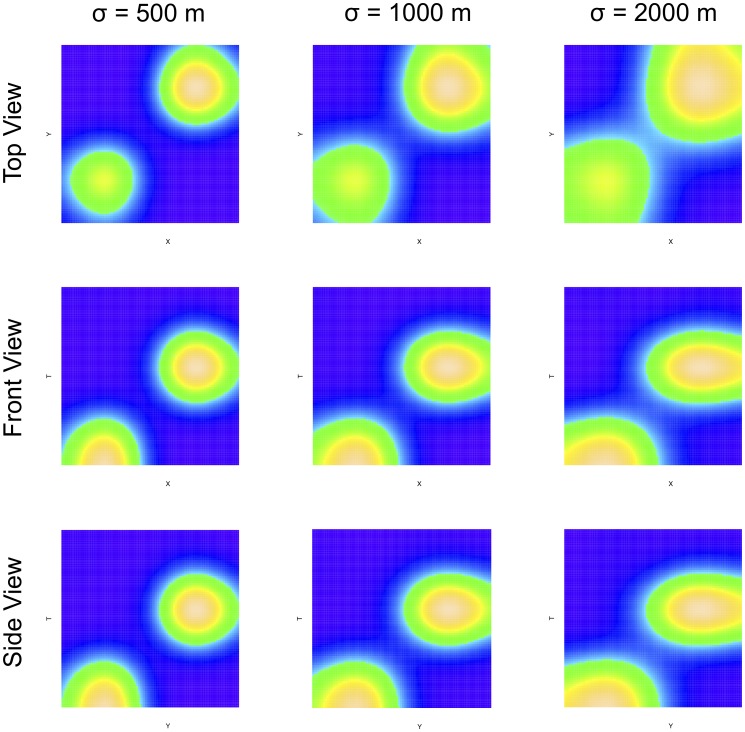
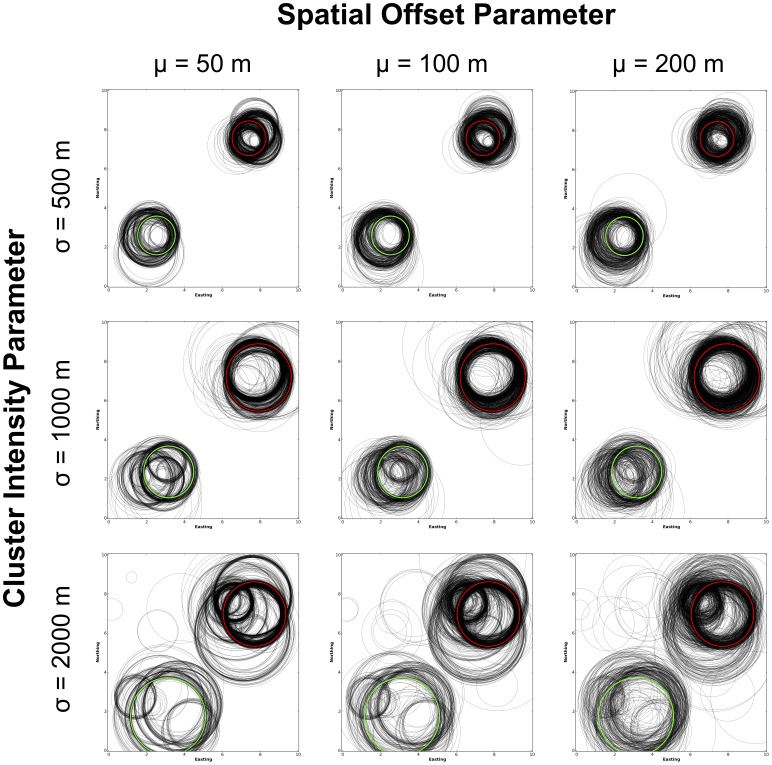
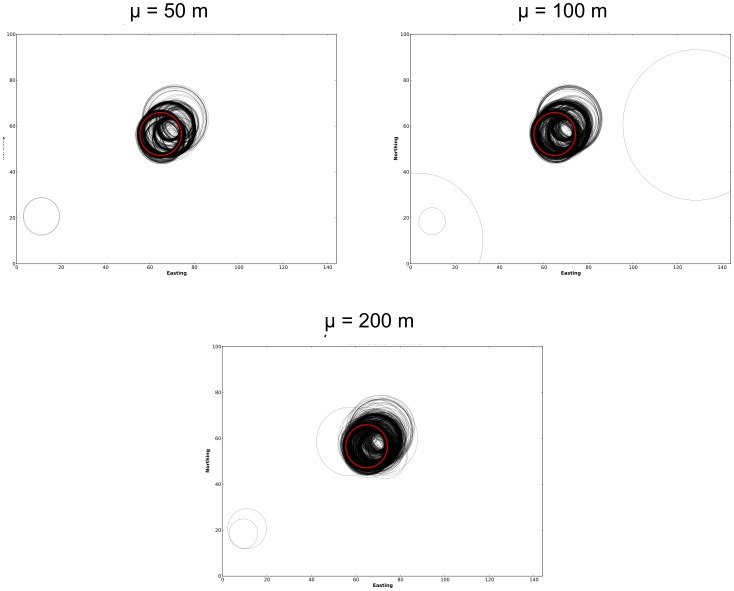
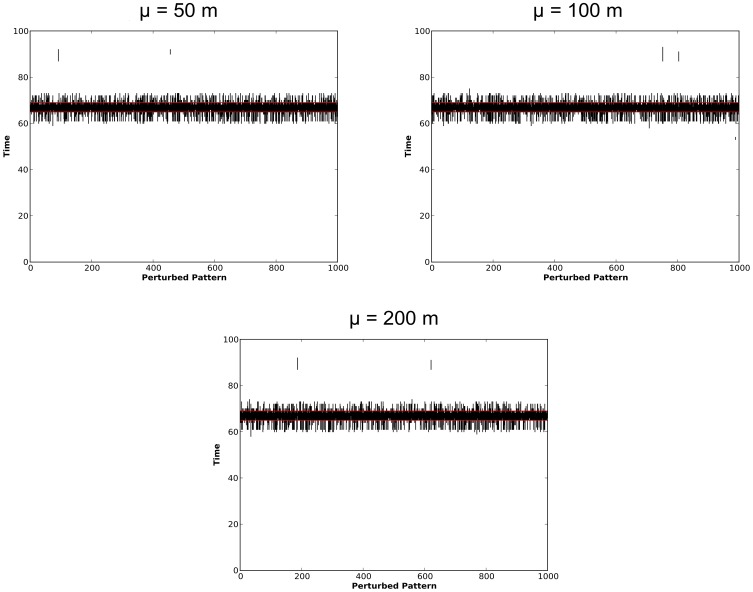
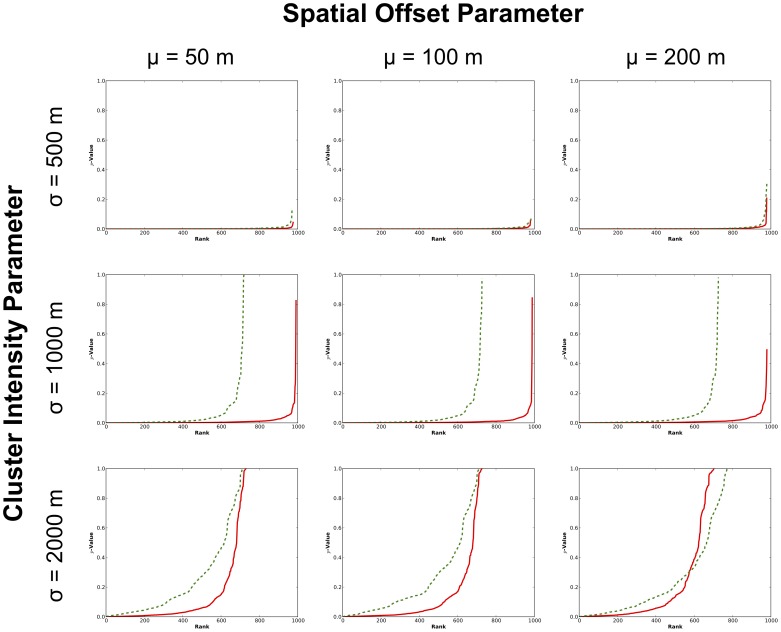
 -value is shown in green. MLCs from perturbed versions of the same dataset are shown in black. The intensity of the original clusters decreases from the top down while the intensity of perturbation increases from the left to the right. This layout is followed in subsequent graphics.
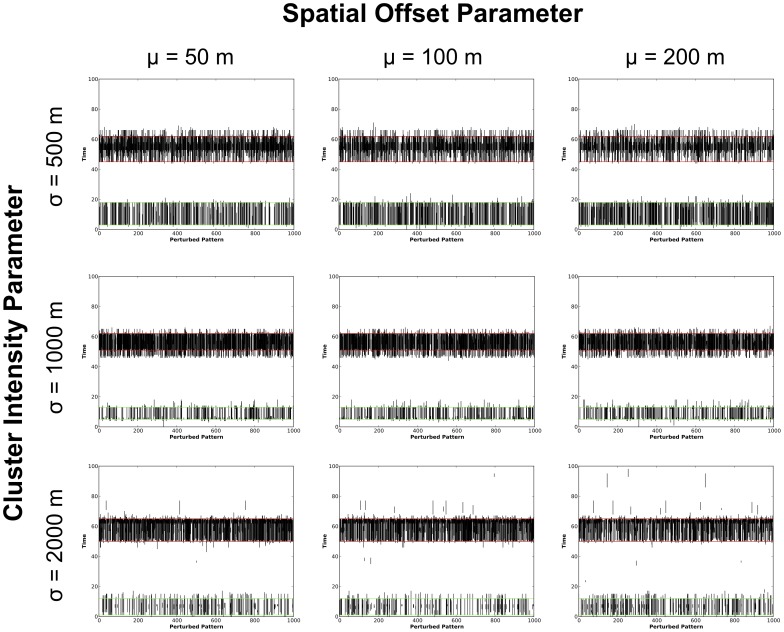
Similar articles
-
Evaluating and implementing temporal, spatial, and spatio-temporal methods for outbreak detection in a local syndromic surveillance system.PLoS One. 2017 Sep 8;12(9):e0184419. doi: 10.1371/journal.pone.0184419. eCollection 2017. PLoS One. 2017. PMID: 28886112 Free PMC article.
-
Detection of spatial, temporal and space-time Salmonella Heidelberg and Salmonella Typhimurium clusters in Ontario in 2015, and comparisons to known outbreaks.Zoonoses Public Health. 2020 Sep;67(6):617-628. doi: 10.1111/zph.12741. Epub 2020 Jun 19. Zoonoses Public Health. 2020. PMID: 32558392
-
Applying Spatio-temporal Scan Statistics and Spatial Autocorrelation Statistics to identify Covid-19 clusters in the world - A Vaccination Strategy?Spat Spatiotemporal Epidemiol. 2021 Nov;39:100461. doi: 10.1016/j.sste.2021.100461. Epub 2021 Oct 25. Spat Spatiotemporal Epidemiol. 2021. PMID: 34774258 Free PMC article.
-
The COVID-19 pandemic and changes in spatio-temporal patterns of suicide: monthly variations among localities in Argentina.Int J Inj Contr Saf Promot. 2024 Mar;31(1):148-152. doi: 10.1080/17457300.2023.2279956. Epub 2023 Nov 8. Int J Inj Contr Saf Promot. 2024. PMID: 37938125
-
Spatio-temporal epidemiology: principles and opportunities.Spat Spatiotemporal Epidemiol. 2011 Mar;2(1):1-9. doi: 10.1016/j.sste.2010.10.001. Epub 2010 Nov 24. Spat Spatiotemporal Epidemiol. 2011. PMID: 22749546 Review.
Cited by
-
COVID-19 Discourse on Twitter in Four Asian Countries: Case Study of Risk Communication.J Med Internet Res. 2021 Mar 16;23(3):e23272. doi: 10.2196/23272. J Med Internet Res. 2021. PMID: 33684054 Free PMC article.
-
Spatiotemporal patterns of infant bronchiolitis in a Tennessee Medicaid population.Spat Spatiotemporal Epidemiol. 2013 Sep;6:17-23. doi: 10.1016/j.sste.2013.05.001. Spat Spatiotemporal Epidemiol. 2013. PMID: 23956809 Free PMC article.
-
Using mobile location data in biomedical research while preserving privacy.J Am Med Inform Assoc. 2018 Oct 1;25(10):1402-1406. doi: 10.1093/jamia/ocy071. J Am Med Inform Assoc. 2018. PMID: 29889279 Free PMC article.
-
Patterns of animal rabies in the Nizhny Novgorod region of Russia (2012-2022): the analysis of risk factors.Front Vet Sci. 2024 Oct 22;11:1440408. doi: 10.3389/fvets.2024.1440408. eCollection 2024. Front Vet Sci. 2024. PMID: 39502946 Free PMC article.
-
Cluster Detection Mechanisms for Syndromic Surveillance Systems: Systematic Review and Framework Development.JMIR Public Health Surveill. 2020 May 26;6(2):e11512. doi: 10.2196/11512. JMIR Public Health Surveill. 2020. PMID: 32357126 Free PMC article.
References
-
- Tango T (2010) Statistical Methods for Disease Clustering. Springer: New York.
-
- Knox E (1964) The detection of space-time interactions. Journal of the Royal Statistical Society Series C (Applied Statistics) 13: 25–30.
-
- Mantel N (1967) The detection of disease clustering and a generalized regression approach. Cancer Research 27: 209–220. - PubMed
-
- Diggle P, Chetwynd A, Haggkvist R, Morris S (1995) Second-order analysis of space-time clustering. Statistical Methods in Medical Research 4: 124. - PubMed
Publication types
MeSH terms
LinkOut - more resources
Full Text Sources
Other Literature Sources
Research Materials
