. 2013;8(2):e54453.
doi: 10.1371/journal.pone.0054453. Epub 2013 Feb 11.

Evolution of predator dispersal in relation to spatio-temporal prey dynamics: how not to get stuck in the wrong place!

Affiliations

Evolution of predator dispersal in relation to spatio-temporal prey dynamics: how not to get stuck in the wrong place!

Justin M J Travis et al. PLoS One. 2013.

Abstract

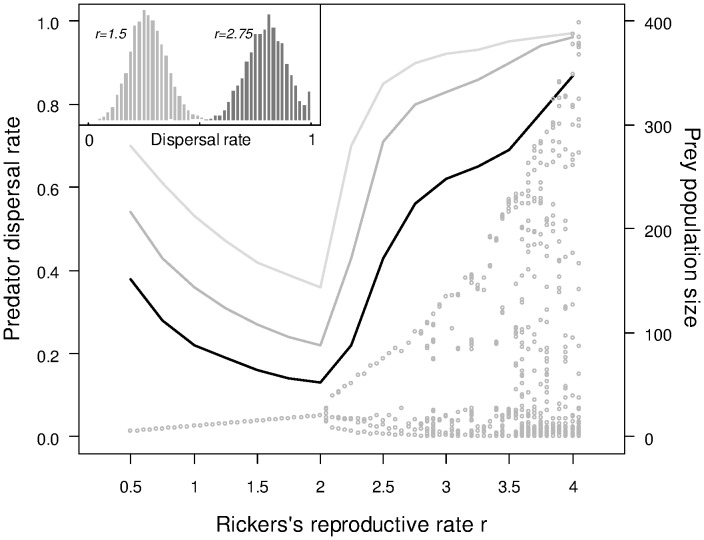
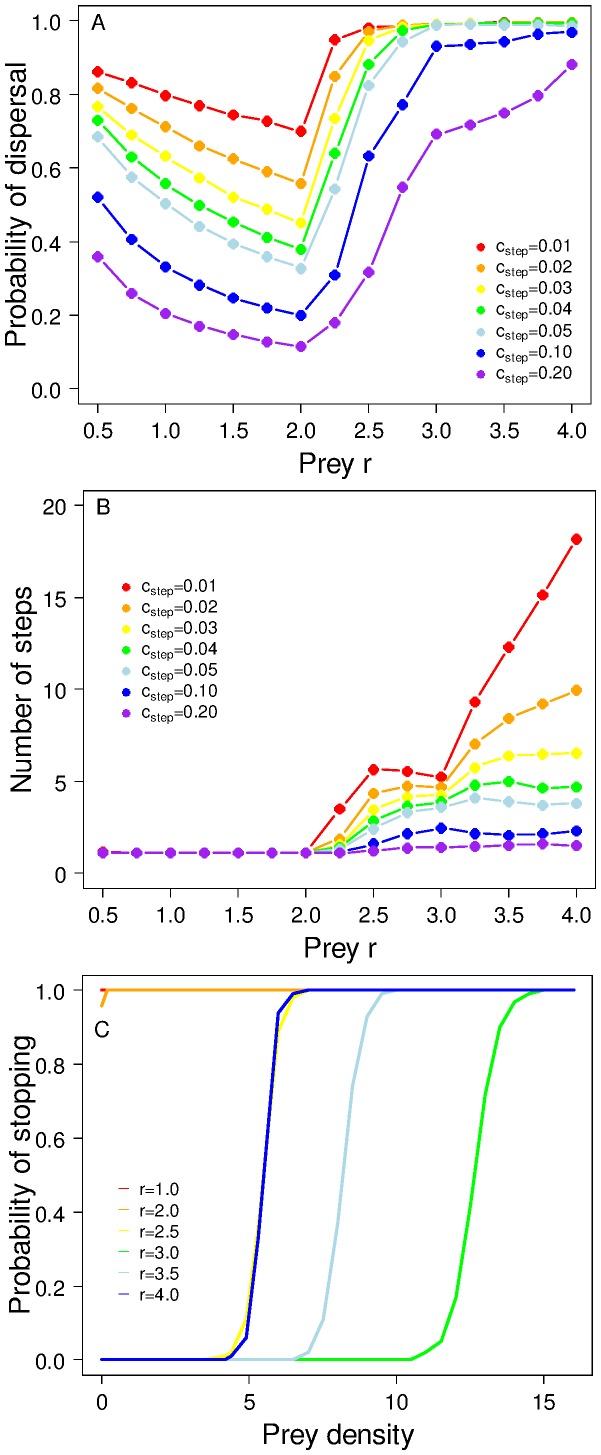
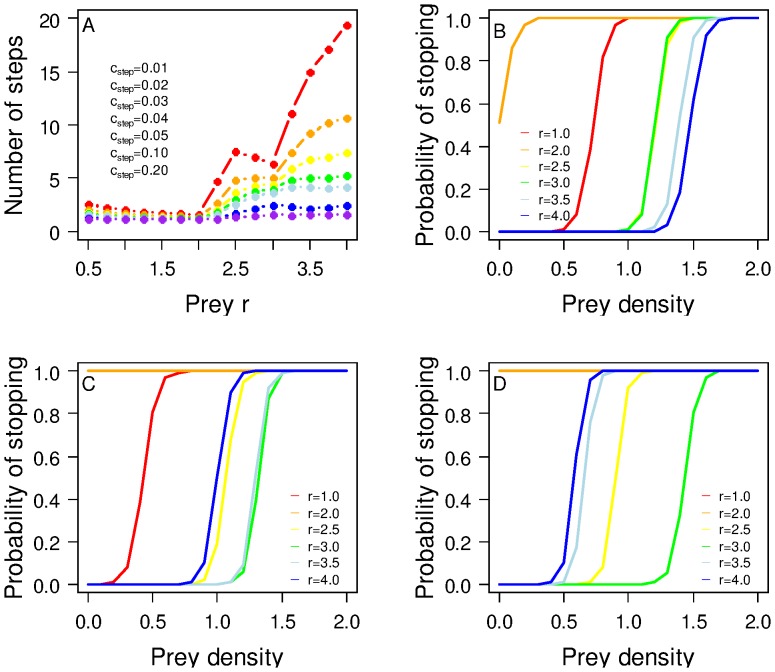
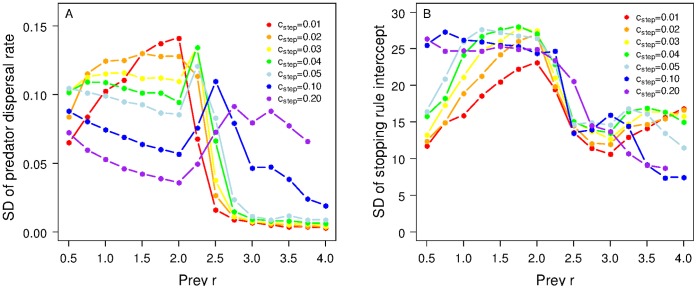
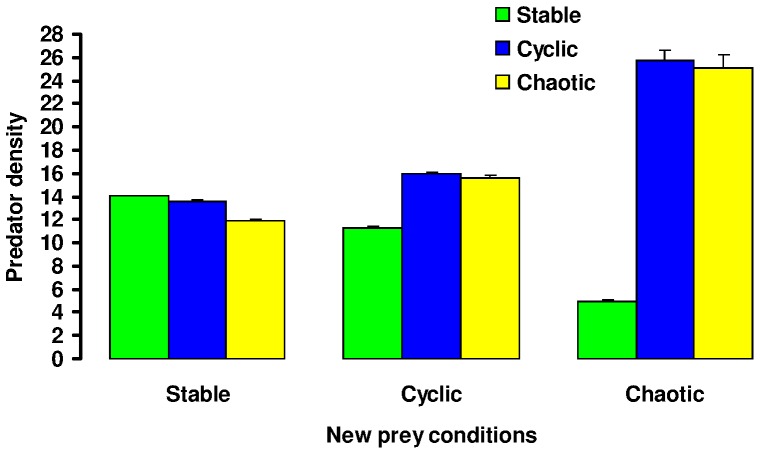
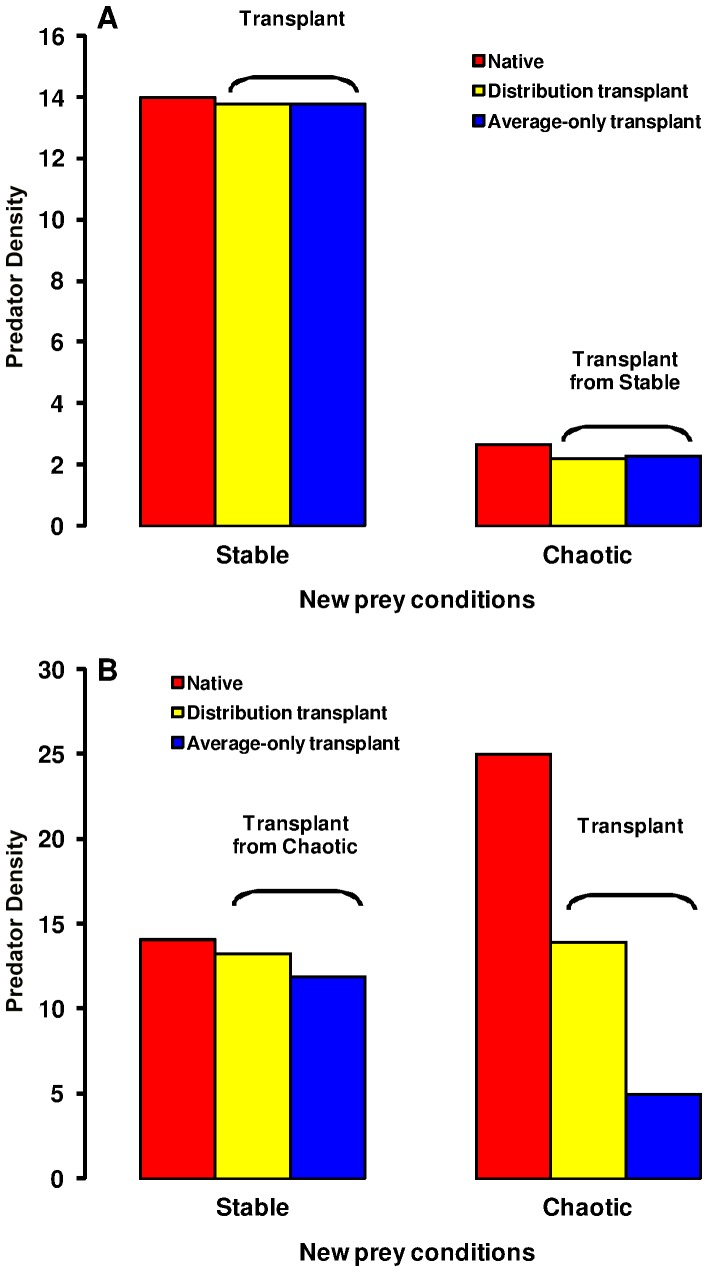
The eco-evolutionary dynamics of dispersal are recognised as key in determining the responses of populations to environmental changes. Here, by developing a novel modelling approach, we show that predators are likely to have evolved to emigrate more often and become more selective over their destination patch when their prey species exhibit spatio-temporally complex dynamics. We additionally demonstrate that the cost of dispersal can vary substantially across space and time. Perhaps as a consequence of current environmental change, many key prey species are currently exhibiting major shifts in their spatio-temporal dynamics. By exploring similar shifts in silico, we predict that predator populations will be most vulnerable when prey dynamics shift from stable to complex. The more sophisticated dispersal rules, and greater variance therein, that evolve under complex dynamics will enable persistence across a broader range of prey dynamics than the rules which evolve under relatively stable prey conditions.


Conflict of interest statement

Competing Interests: The authors have declared that no competing interests exist.

Figures

Figure 1
Figure 1. Evolution of predator emigration probability.
Average predator emigration probabilities obtained after the model stabilized (left y-axis) for a range of r between 0.5 and 4.0 (by increments of 0.5). The three lines represent three different mortality costs of dispersal imposed on predators (from light grey to black: c = 0.05, 0.1, 0.2 respectively, see Methods). The bifurcation diagram shows the distribution of stable limits of the prey dynamics for the range of r values (right y-axis).The extent of variation in predator emigration probability at the population level is shown for two sets of simulations in the inserted panel (cost of dispersal c = 0.1 for both).
Figure 2
Figure 2. Evolution of a more complex predator dispersal strategy.
A qualitatively similar response of dispersal to varying prey r is observed when predators can take multiple steps and evolve a stopping rule dependent on prey density. (A) Dispersal probability at seven levels of predator per-step dispersal mortality cstep. (B) The mean number of steps taken by predators across the same range of r and cstep as in (A). The number of steps taken by predators is a function of the rules that they have evolved, together with the spatio-temporal characteristics of the environment. (C) The mean stopping rules that evolve for a range of prey r at a moderate per-step mortality (cstep = 0.02). The ‘slope’ gene determines the ‘steepness’ of the stopping threshold (the rate of change of probability with increasing prey density), and the ‘slope’ and ‘intercept’ genes together control the position of the stopping threshold in relation to prey density.
Figure 3
Figure 3. Predators are choosier and take more steps when the per-step cost of dispersal is low.
Here we illustrate results obtained when the predators evolve a stopping rule that is sensitive to the ratio of prey per predator. The mean number of steps taken by predators is shown for a range of prey r and per-step mortality cstep in A. In B, C and D, we show the mean stopping rules that evolve for cstep = 0.02, 0.04 and 0.10, respectively.
Figure 4
Figure 4. Within-population variability in dispersal rules depends upon spatio-temporal prey dynamics.
As well as determining the mean dispersal rules, the underlying prey dynamics influence the emergent heterogeneity in dispersal rules. (A) The standard deviation in the emigration probability across a range of prey r. (B) The standard deviation in the intercept of the reaction norm that determines the stopping probability as a function of prey per predator. All parameters values are as for Fig 3. Note that where there are missing values it is due to the predator populations always going to extinction; this occurs when prey r and cstep are both high.
Figure 5
Figure 5. Typical results from a transplant experiment: the density of populations (predators per landscape cell) applying rules evolved under stable (prey r = 1.5), cyclic (r = 2.5) and complex (r = 3.5) prey dynamics when they are placed into each of those three conditions.
It is clear that while the strategies that evolve under cyclic or complex prey dynamics prove quite robust within other prey environments, the strategy that evolves under stable prey dynamics results in substantially reduced population density when it is placed in a more complex prey landscape. Mean population sizes are calculated from the 20th to 30th generations following transplantation. Transplanted predators had genes equal to the population mean values, the stopping rule based on prey per predator was employed, and per-step mortality cstep was fixed at 0.02 in all cases.
Figure 6
Figure 6. Variability in emigration probability and transplant success.
Predator population size following transplant experiments between stable and chaotic prey landscapes involving predators with average-only emigration propensity or predators with their evolved distribution of emigration probabilities. In (A) the results are for the model where only emigration probability evolves. In (B) the results are for the more complex dispersal strategy where emigration rate evolves along with a stopping rule based on the ratio of prey to predators. These results are for the same parameter values as used in Fig. 5.

Similar articles

Cited by

References

    1. Bowler DE, Benton TG (2005) Causes and consequences of animal dispersal strategies: relating individual behaviour to spatial dynamics. Biol. Rev. Cambridge Phil. Soc. 80: 205–225. - PubMed
    1. Simmons AD, Thomas CD (2004) Changes in dispersal during species’ range expansions. Am. Nat. 164: 378–395. - PubMed
    1. Phillips BL, Brown GP, Webb JK, Shine R (2006) Invasion and the evolution of speed in toads. Nature 439: 803. - PubMed
    1. Lachmuth S, Durka W, Schurr FM (2011) Differentiation of reproductive and competitive ability in the invaded range of Senecio inaequidens: the role of genetic Allee effects, adaptive and nonadaptive evolution. New Phyt 192: 529–541 doi:10.1111/j.1469–8137.2011.03808.x. - DOI - PubMed
    1. Kokko H, Lopez-Sepulcre A (2006) From Individual Dispersal to Species Ranges: Perspectives for a Changing World. Science 313: 789–791 doi:10.1126/science.1128566. - DOI - PubMed

Publication types

LinkOut - more resources