. 2013;8(2):e54511.
doi: 10.1371/journal.pone.0054511. Epub 2013 Feb 7.

dnc-1/dynactin 1 knockdown disrupts transport of autophagosomes and induces motor neuron degeneration

Affiliations

dnc-1/dynactin 1 knockdown disrupts transport of autophagosomes and induces motor neuron degeneration

Kensuke Ikenaka et al. PLoS One. 2013.

Abstract

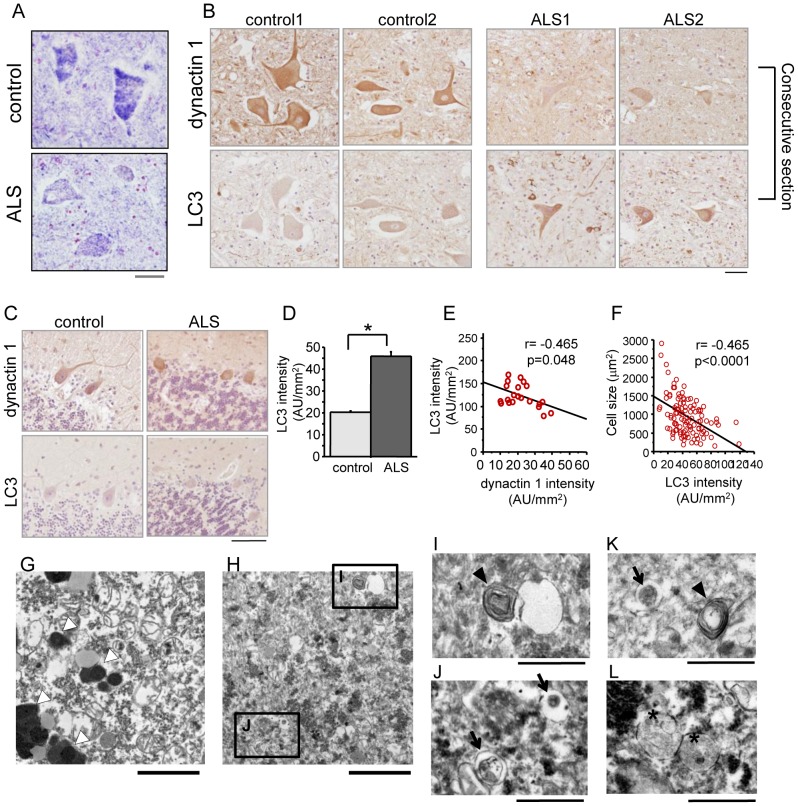
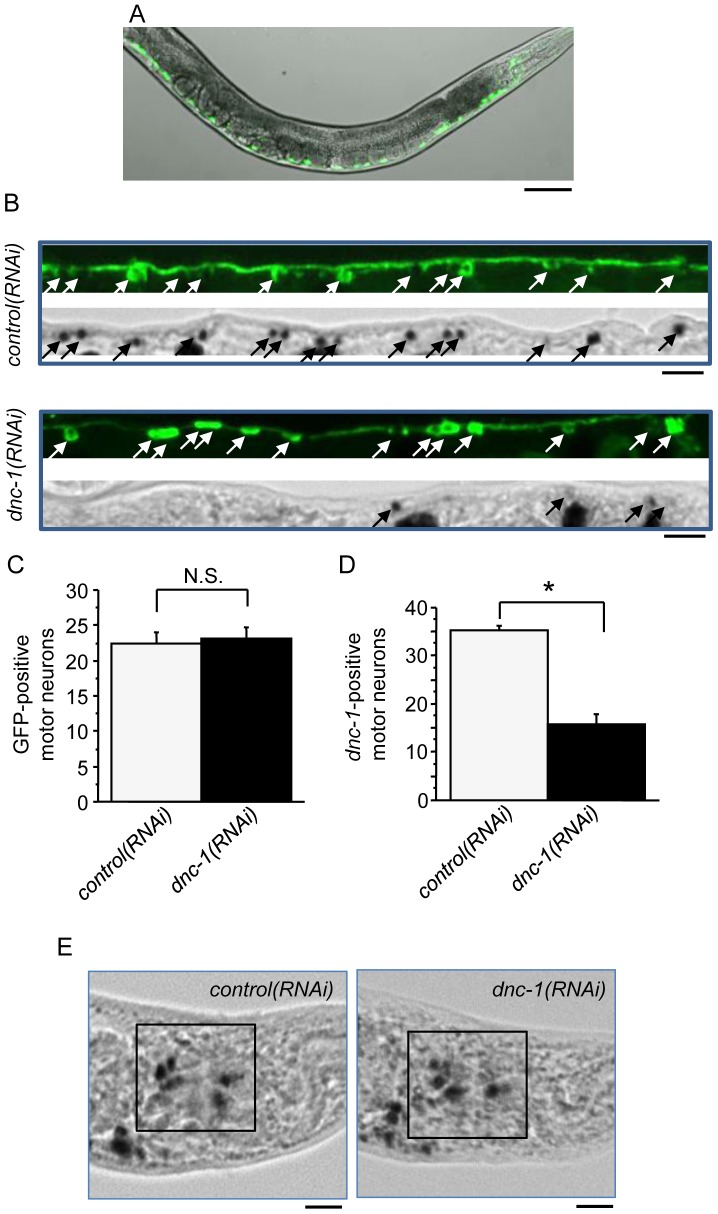
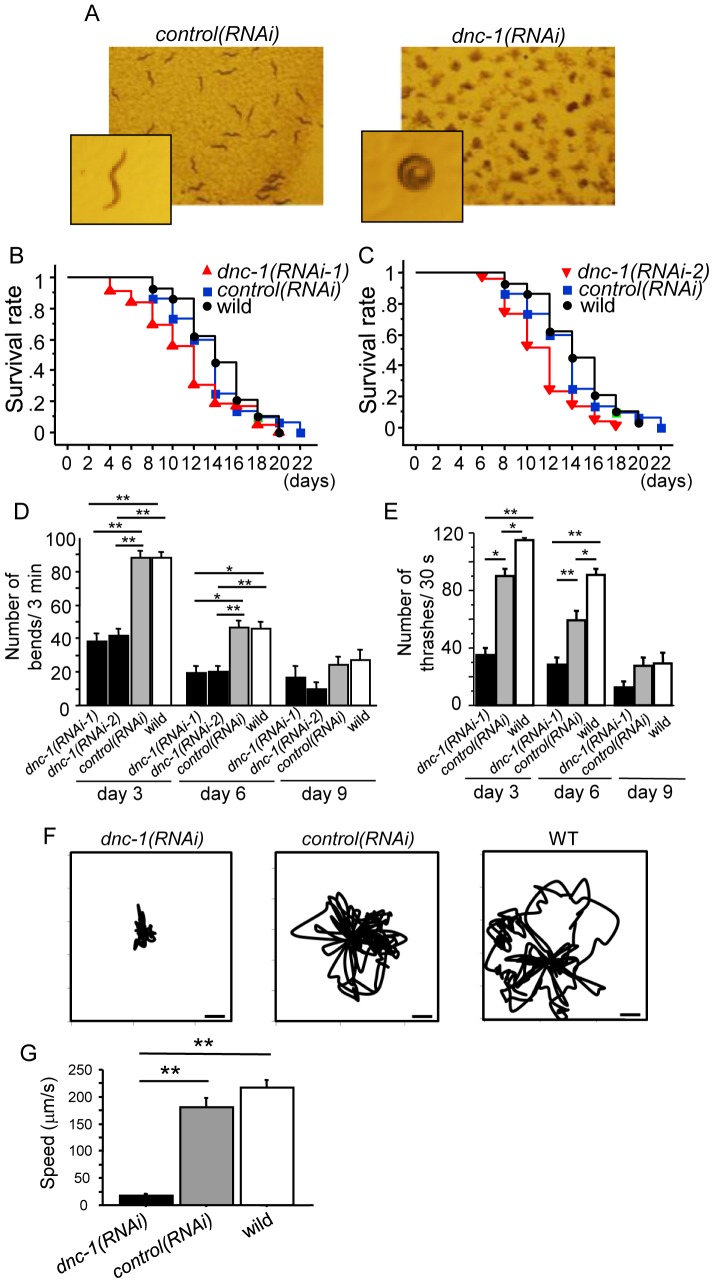
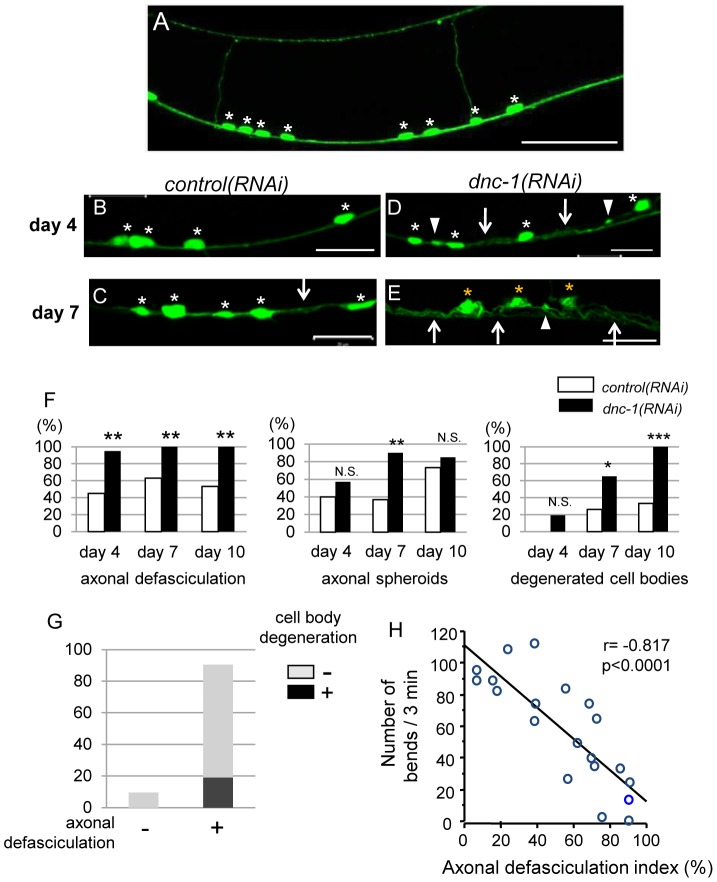
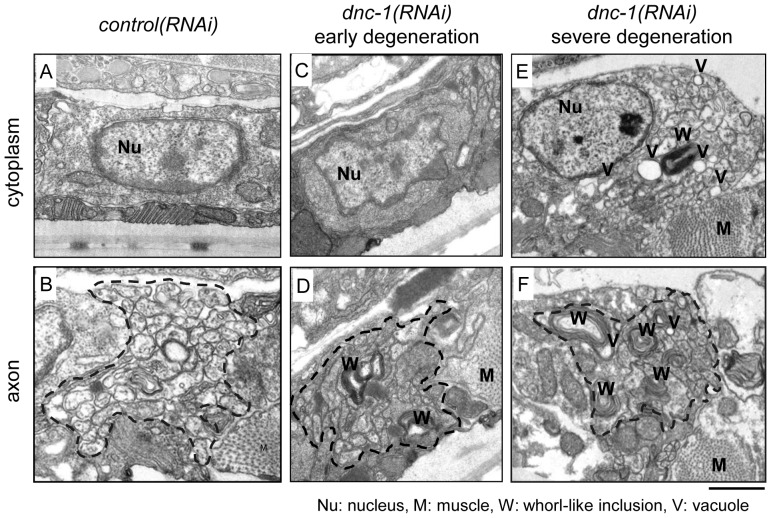
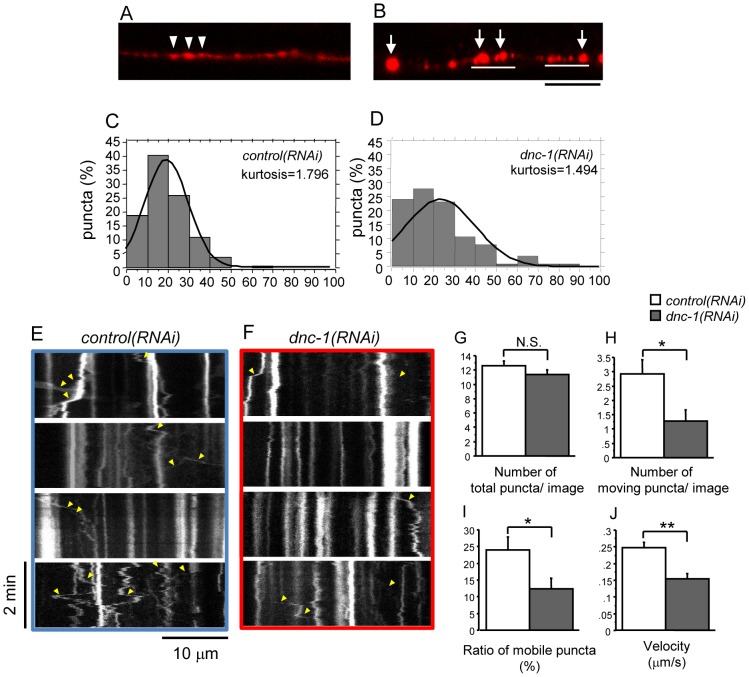
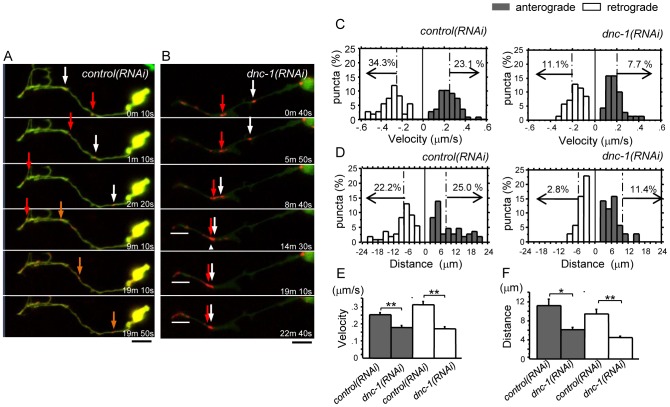
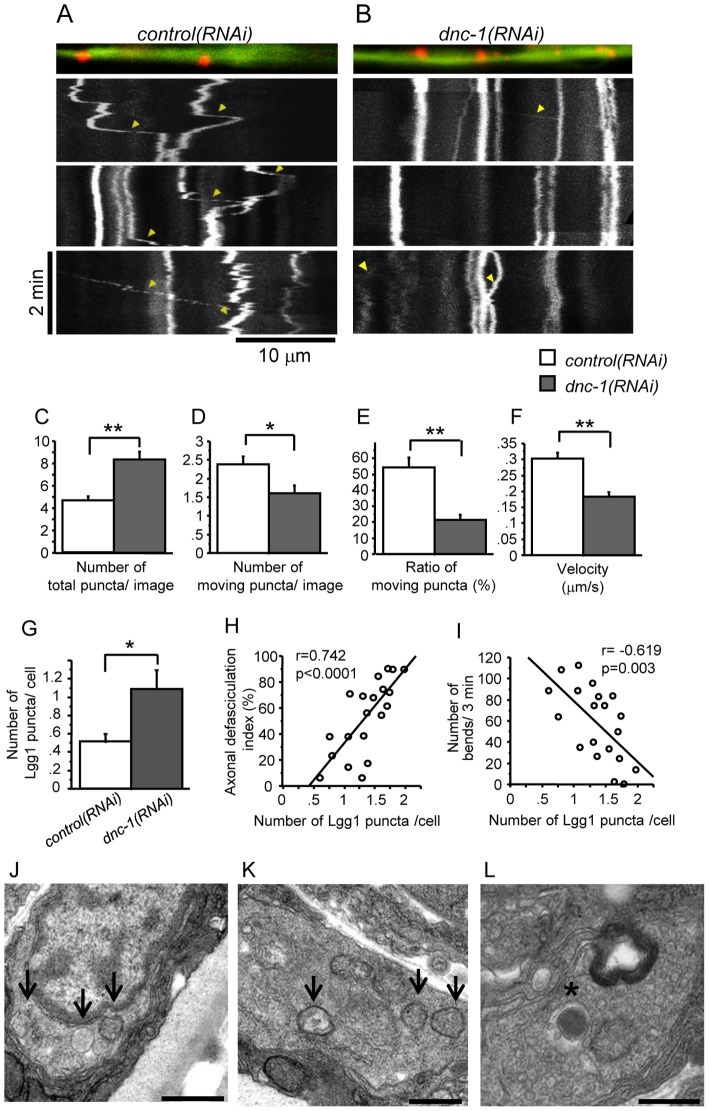
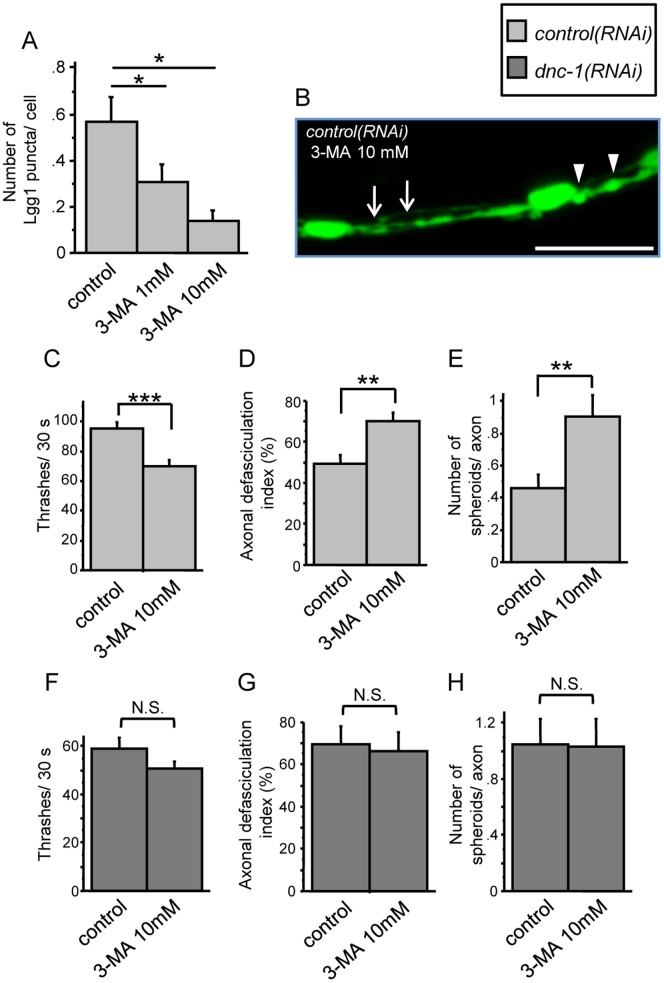
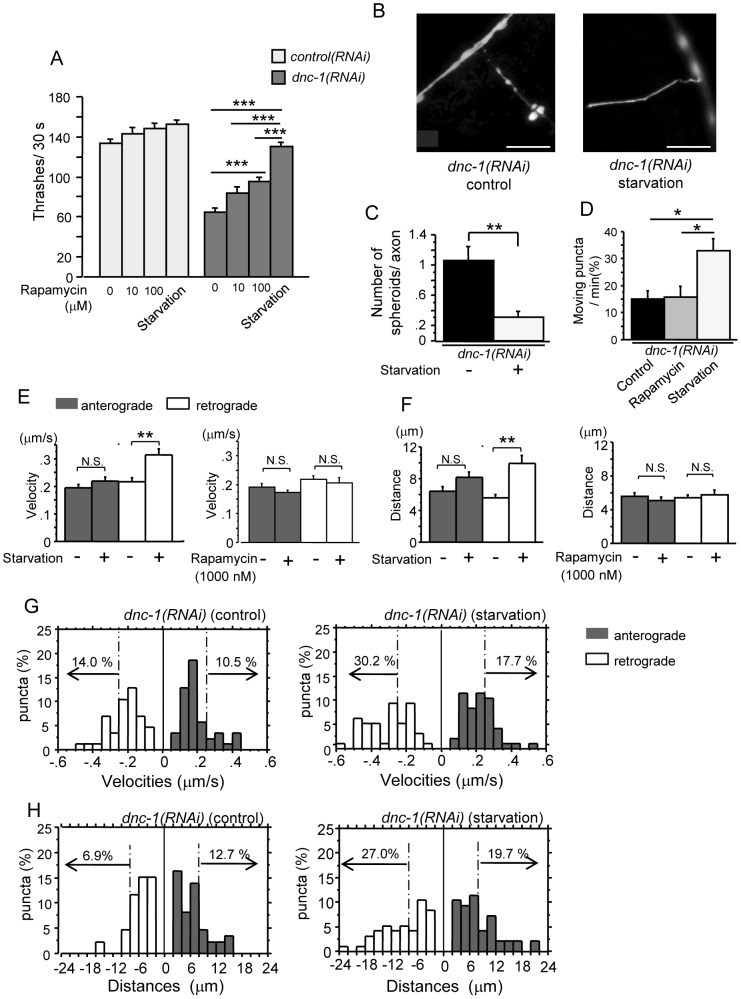
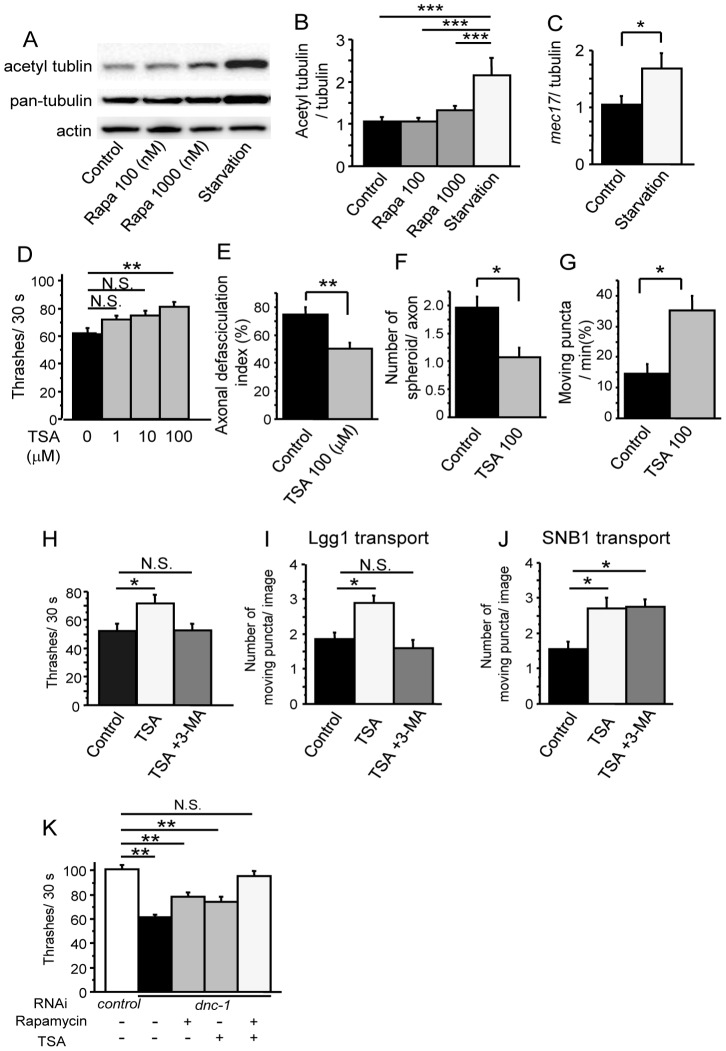
Amyotrophic lateral sclerosis (ALS) is a fatal neurodegenerative disease characterized by the progressive loss of motor neurons. We previously showed that the expression of dynactin 1, an axon motor protein regulating retrograde transport, is markedly reduced in spinal motor neurons of sporadic ALS patients, although the mechanisms by which decreased dynactin 1 levels cause neurodegeneration have yet to be elucidated. The accumulation of autophagosomes in degenerated motor neurons is another key pathological feature of sporadic ALS. Since autophagosomes are cargo of dynein/dynactin complexes and play a crucial role in the turnover of several organelles and proteins, we hypothesized that the quantitative loss of dynactin 1 disrupts the transport of autophagosomes and induces the degeneration of motor neuron. In the present study, we generated a Caenorhabditis elegans model in which the expression of DNC-1, the homolog of dynactin 1, is specifically knocked down in motor neurons. This model exhibited severe motor defects together with axonal and neuronal degeneration. We also observed impaired movement and increased number of autophagosomes in the degenerated neurons. Furthermore, the combination of rapamycin, an activator of autophagy, and trichostatin which facilitates axonal transport dramatically ameliorated the motor phenotype and axonal degeneration of this model. Thus, our results suggest that decreased expression of dynactin 1 induces motor neuron degeneration and that the transport of autophagosomes is a novel and substantial therapeutic target for motor neuron degeneration.


Conflict of interest statement

Competing Interests: The authors have declared that no competing interests exist.

Figures

Figure 1
Figure 1. Dysregulated expression of dynactin 1 and the accumulation of autophagosomes in SALS patients.
(A) Representative in situ hybridization for DCTN1 in the spinal cords of control and ALS patients. (B, C) Representative immunohistochemistry for dynactin 1 and microtubule-associated protein 1 light chain 3 alpha (LC3) on consecutive spinal cord (B) and cerebellar (C) sections from control and ALS patients. (D) Quantification of the signal intensity of LC3 in anterior horn neurons of the spinal cord (n = 20 sections from 4 patients for each group). (E) Correlation between LC3 intensity and the expression of DCTN1 in individual motor neurons from SALS patients (n = 12 consecutive sections from 3 SALS patients). (F) Correlation between the intensity of LC3 immunoreactivity and the size of motor neurons in SALS patients (n = 20 sections from 4 patients). (G–L) Electron microscopy images of spinal motor neurons. Representative lower magnification image of a motor neuron from a control patient (G) and lower (H) and higher magnification images (I–L) from SALS patients. The open arrowheads indicate lipofuscin. There were abundant autophagic vacuoles, e.g., multi-lamellar bodies (arrowheads in I, K), autophagosome-like double membrane vesicles (arrows in K, J), and autolysosomes (asterisks in L) in the motor neurons of SALS patients, but not of the control. Scale bar = 50 μm (A–C), 2 μm (G, H), or 1μm (I–L). Statistical analyses were performed using Student's t test (*p<0.0001) and Pearson's correlation coefficient in E and F. The error bars are S.E.M.
Figure 2
Figure 2. Creation of the motor neuron-specific dnc-1-KD C. elegans model.
(A) Fluorescent visualization of ventral cholinergic motor neurons and their neurites in transgenic C. elegans worms expressing acr2p::shRNA::gfp. (B) Representative immunohistochemical staining of GFP and in situ hybridization against dnc-1 in ventral cholinergic motor neurons and their neurites in the control(RNAi) and dnc-1(RNAi) worms. (C) The number of GFP-positive motor neurons (white arrows in B) was not significantly different between the control(RNAi) and dnc-1(RNAi) worms (n = 20 animals for each strain). (D) Conversely, the number of dnc-1 mRNA-positive neurons (black arrows in B) was remarkably decreased in the dnc-1(RNAi) worms (n = 20 animals for each strain). (E) Representative images of in situ hybridization for dnc-1 in the head neurons. Scale bars = 100 μm (A), 10 μm (B), and 20 μm (E). Statistical analyses were performed using Student's t test (*p<0.0001). The error bars are S.E.M.
Figure 3
Figure 3. Motor dysfunction in the motor neuron-specific dnc-1-KD C. elegans model.
(A) Stereoscopic microscopy showing the phenotypes of the control(RNAi) and dnc-1(RNAi) worms. (B, C) Survival curves of the transgenic worms (dnc-1(RNAi-1), n = 90; dnc-1(RNAi-2), n = 90; control(RNAi) n = 90; and wild-type n = 30). The same survival data of the control(RNAi)and wild-type worms were used in both graphs. Both dnc-1(RNAi) worms with different shRNA sequences (101, 2888) had significantly reduced life spans compared with the control(RNAi) worms (101: p = 0.005; 2888: p<0.0001; log-rank test). (D) The number of body bends associated with forward movement in 3 min. (E) The number of thrashing movements in liquid medium in 30 s. (F, G) The tracks (F) and average speed of the worms (G) analyzed by video capture at day 4. Scale bars in F = 100 μm. The error bars are S.E.M. (n = 30, 30, 40, and 40 for dnc-1(RNAi-1), dnc-1(RNAi-2), control(RNAi), and wild-type, respectively, in D, E; and n = 6, 6, and 6 for dnc-1(RNAi-1), control(RNAi), and wild-type, respectively, in G). The statistical analyses in C, D, and F were performed by one-way ANOVA followed by the Bonferroni/Dunn post hoc test (*p<0.001 and **p<0.0001).
Figure 4
Figure 4. Morphological changes in ventral motor neurons.
(A) Representative view of fluorescent GFP microscopic images of the ventral nerve cord in a control(RNAi) C. elegans. All of the motor neurons (white asterisks) were located in the ventral side of the worm. Axons from the motor neurons project within the ventral nerve cord or toward the dorsal side. (B–E) Representative view of the ventral nerve cord in the control(RNAi) worms (B, C) and dnc-1(RNAi) worms (D, E). The degenerated axons were defasciculated (arrows in D, E) and formed spheroids (arrowheads in D, E) in the dnc-1(RNAi) worms. Mild defasciculation was observed occasionally in the control(RNAi) worms (arrow in C). While the cell bodies of the motor neurons were regular and round in control(RNAi) and young adult dnc-1(RNAi) worms (white asterisks in B–D), abnormally shaped cell bodies (yellow asterisks in E) were observed only in the worms with severe axonal changes. (F) Semi-quantification of the abnormal morphological changes in the control(RNAi) and dnc-1(RNAi) worms. The percentage of worms with axonal defasciculation, axonal spheroids, or cell body degeneration on days 4, 7, and 10. (G) Population of dnc-1(RNAi) worms with and without cell body degeneration (black and gray boxes, respectively) on day 4. (H) Correlation between the axonal defasciculation index and locomotor function in the dnc-1(RNAi) worms. The axonal defasciculation index represents the degree of axonal defasciculation (its details are described in the Materials and Methods). Scale bars = 20 μm. The statistical analysis in F was performed using Fisher's exact probability test (*p<0.05, **p<0.001, and ***p<0.0001) and Pearson's correlation coefficient in H.
Figure 5
Figure 5. Ultrastructure of degenerating motor neurons.
Electron microscopy of transverse sections of ventral motor neurons from the control(RNAi) (A, B) and dnc-1(RNAi) (C–F) worms. The dashed lines in B, D, and F denote the boundaries of the main bundle of axons. Each round-shaped component inside the dashed line is an axon. In the dnc-1(RNAi) worms, whorl-like inclusions (W) and vacuoles (V) were observed (D–F). In the worms with mild axonal degeneration (D), few morphological changes were observed in the cytoplasm (C); however, in the later stage with severe axonal degeneration (F), the cell bodies were also affected (E). Scale bars = 20 μm.
Figure 6
Figure 6. Defective axonal transport of synaptobrevin-1 in dnc-1 ( RNAi ) C. elegans.
(A, B) Expression patterns of DsRed-tagged synaptobrevin-1 (SNB-1) in the dorsal nerve cord. In the control(RNAi) worms, SNB-1 puncta (arrowheads) are regularly spaced with a uniform shape. In the dnc-1(RNAi) worms (B), they are irregularly spaced and abnormally accumulated (white bars) with occasional clumps. (C, D) Histograms of the distances between neighboring SNB-1 puncta. The average distance between puncta in the control(RNAi) (3.240±1.716 μm, n = 139) and dnc-1(RNAi) (3.855±2.764 μm, n = 104) worms was not significantly different (p = 0.996 by Student's t test), but the peak of the control histogram was higher than that of the dnc-1(RNAi) histogram, proving that the localization of SNB1 was irregular. (E, F) Representative kymographs of SNB-1::DsRed in the ventral nerve cord from the control(RNAi) (E) and dnc-1(RNAi) (F) worms derived from time-lapse imaging. Vertical lines represent stationary/docked SNB-1 puncta and oblique lines (labeled with yellow arrowheads) represent the tracks of moving SNB-1 puncta. The slope of this track is an indicator of velocity. (G) The number of SNB-1 puncta within a single image of kymograph was not different between the control(RNAi) and the dnc-1(RNAi) worms. (H) The mean velocities of SNB-1 puncta. (I, J) The quantitative analysis of mobile puncta. The number of puncta which moved more than 2 μm was counted (I). The ratio of moving puncta was calculated by dividing the number of moving puncta by the total number of SNB-1 puncta (J). A total of 20 time laps images were analyzed from each strains in GJ. Scale bar (black)  = 10 μm (B). Statistical analyses were performed using Student's t test (*p<0.05, **p<0.001, ***p<0.0001). Error bars are S.E.M.
Figure 7
Figure 7. Impaired transport and abnormal accumulation of autophagosomes in the axons of dnc-1 ( RNAi ) motor neurons.
(A, B) Representative time-lapse images of autophagosome (DsRed-tagged Lgg1) transport in an axon (GFP-tagged shRNA; green) of a primary cultured motor neuron from the control(RNAi) (A) and dnc-1(RNAi) (B) worms. The autophagosomes were transported smoothly along the axon (arrows) of the control(RNAi) motor neuron (A). The autophagosome (arrows) was transported anterogradely, but was trapped where the axon was slightly narrowed (arrowhead) (B). There were also autophagosomes that accumulated in the distal part of the axon (B, bar). (C) Histograms of Lgg1::DsRed velocity in the retrograde (white bars) and anterograde (black bars) directions in neurons from the control(RNAi) and dnc-1(RNAi) worms. (D) Histograms of Lgg1::DsRed run-length in the control(RNAi) and dnc-1(RNAi) neurons. (E, F) Mean velocity (E) and run-length (F) of autophagosomes (n = 70 vesicles for each strain) in control(RNAi) and dnc-1(RNAi) neurons. Scale bar = 5 μm (A and B). The statistical analyses in E and F were performed using the Mann-Whitney U test (*p<0.05 and **p<0.0001). The error bars are S.E.M.
Figure 8
Figure 8. Accumulation of autophagosomes and motor neuron degeneration in the dnc-1 ( RNAi ) worms.
(A, B) Representative kymographs of Lgg1::DsRed in the ventral nerve cord from the control(RNAi (A) and dnc-1(RNAi) (B) worms derived from time-lapse images. Vertical lines represent stationary/docked Lgg1 puncta, while the oblique lines (labeled with arrowheads) represent the tracks of moving Lgg1 puncta. The slope of this track is an indicator of velocity. (C) The number of Lgg1 puncta within a single kymograph image. (D, E) Quantitative analyses of the mobility of puncta. The number of puncta that moved more than 2 μm was counted (D). The ratio of moving puncta was calculated by dividing the number of moving puncta by the total number of puncta (E). (F) The mean velocities of Lgg1 puncta. A total of 20 time-lapse images were analyzed for each strain in C–F. (G) The number of Lgg1 puncta was increased in the dnc-1(RNAi) worms compared with the control(RNAi) worms (n = 15 for each group). (H, I) Accumulation of autophagosomes in the dnc-1(RNAi) worms was correlated with the severity of axonal defasciculation (H) and locomotor function (I) (n = 20 for each analysis). (J–L) Ultrastructural images of ventral motor neurons from the dnc-1(RNAi) worms. Aberrant membranous vesicles including degenerated mitochondria were observed in the cytoplasm (J) and axons (K) (arrows). Autophagosome-like, double membrane vesicles (asterisk in L) were also found in the axons of the dnc-1(RNAi) worms (L). Scale bar = 500 nm (A–C) or 10 μm (D). Statistical analyses were performed using Student's t test (*p<0.05 and **p<0.0001) and Pearson's correlation coefficient in H and I. The error bars are S.E.M.
Figure 9
Figure 9. Dysfunction of autophagy causes axonal degeneration.
(A) Treatment with 3-MA decreased the number of autophagosomes in the ventral nerve cord in a dose dependent manner (n = 15 for each group). (B–E) The effects of 3-MA on the locomotor function (C) and axonal morphology (B, D, and E) of the control(RNAi) worms. Treatment with 3-MA increased axonal defasciculation (arrows in B and the graph in D) and the number of axonal spheroids (arrowheads in B and the graph in E) (n = 15 for each group). (F–H) The effects of 3-MA on the locomotor function (F) and axonal morphology (G, H) of the dnc-1(RNAi) worms (n = 15 for each group). Scale bar = 10 μm. Statistical analyses were performed using Dunnett's post hoc test (A) and Student's t test (B, D, and E) (*p<0.05, **p<0.001, and ***p<0.0001). The error bars are S.E.M.
Figure 10
Figure 10. Starvation stimulates the retrograde transport of autophagosomes and attenuates axonal degeneration in the dnc-1 ( RNAi ) worms.
(A) Effect of rapamycin and starvation on locomotor function in the control(RNAi) and dnc-1(RNAi) worms (n = 50 for each group). (B) Fluorescent microscopy showing the morphological changes in axons after starvation in the dnc-1(RNAi) worms. (C) The number of axonal spheroids per transverse axon section in the dnc-1(RNAi) worms with or without starvation. (n = 15 animals for each treatment). (D) Effect of rapamycin (100 μM) and starvation on autophagosome mobility in the dnc-1(RNAi) worms. (n = 15 animals for each treatment). (E, F) Effect of rapamycin (100 μM) and starvation on the mean velocity (E) and run-length (F) of autophagosomes (black bars: anterograde transport; white bars: retrograde transport) (n = 70 vesicles for each treatment). (G, H) Histograms of Lgg1::DsRed velocity (F) and run-length (G) in the anterograde (black bars) and retrograde (white bars) direction in primary motor neurons from the dnc-1(RNAi) worms cultured with normal (control) and serum-free (starvation) medium. Scale bars = 5 μm. Statistical analyses were performed by one-way ANOVA followed by the Bonferroni/Dunn post hoc test (A) and Dunnett's post hoc test (D). Student's t test (C) and Mann-Whitney test (E, F) were used for two-group comparison (*p<0.05, **p<0.001, and ***p<0.0001). The error bars are S.E.M.
Figure 11
Figure 11. The effects of tubulin acetylation on the transport of autophagosome and neurodegneration in the dnc-1 ( RNAi ) worms.
(A, B) Immunoblots of primary cultured cells using antibodies against acetylated tubulin, pan-tubulin, and actin (n = 5). (C) The mRNA levels of mec17 measured by real-time RT-PCR. The data shown are ratios to the mRNA levels of tba1, the gene encoding alpha-tubulin. (D) Effect of trichostatin A (TSA) on the locomotor function of the dnc-1(RNAi) worms (n = 35 for each group). (E–G) Effect of TSA (100 μM) on the axonal degeneration of the dnc-1(RNAi) worms (E, F) and on autophagosome mobility (G) (n = 15 for each group). (H) The inhibition of autophagy by 3-MA (10 mM) negates the effect of TSA treatment on the motor function of the dnc-1(RNAi) worms (n = 35 for each group). (I, J) The number of moving puncta (I, Lgg1; J, SNB1) was counted using kymographs derived from in vivo time-lapse images (n = 20 images for each analysis). Treatment with 3-MA negates the effect of TSA treatment on the transport of Lgg1 (I), but not the transport of SNB1 (J). (K) Combination therapy of rapamycin (100 μM) and TSA (100 μM) has synergistic effects on the locomotive functions of the dnc-1(RNAi) worms (n = 35 for each group). Statistical analyses were performed by one-way ANOVA followed by the Bonferroni/Dunn post hoc test for (B), Dunnett's post hoc test (D, H–K), and Student's t test (C, E–G) (*p<0.05, **p<0.001, and ***p<0.0001). The error bars are S.E.M.

Similar articles

Cited by

References

    1. Klionsky DJ, Emr SD (2000) Autophagy as a regulated pathway of cellular degradation. Science 290: 1717–1721. - PMC - PubMed
    1. Hara T, Nakamura K, Matsui M, Yamamoto A, Nakahara Y, et al. (2006) Suppression of basal autophagy in neural cells causes neurodegenerative disease in mice. Nature 441: 885–889. - PubMed
    1. Komatsu M, Waguri S, Chiba T, Murata S, Iwata J, et al. (2006) Loss of autophagy in the central nervous system causes neurodegeneration in mice. Nature 441: 880–884. - PubMed
    1. Ravikumar B, Acevedo-Arozena A, Imarisio S, Berger Z, Vacher C, et al. (2005) Dynein mutations impair autophagic clearance of aggregate-prone proteins. Nat Genet 37: 771–776. - PubMed
    1. Komatsu M, Wang QJ, Holstein GR, Friedrich VL Jr, Iwata J, et al. (2007) Essential role for autophagy protein Atg7 in the maintenance of axonal homeostasis and the prevention of axonal degeneration. Proc Natl Acad Sci U S A 104: 14489–14494. - PMC - PubMed

Publication types

MeSH terms

Substances