. 2013;8(2):e55362.
doi: 10.1371/journal.pone.0055362. Epub 2013 Feb 7.

Multiple genetic alterations within the PI3K pathway are responsible for AKT activation in patients with ovarian carcinoma

Affiliations

Multiple genetic alterations within the PI3K pathway are responsible for AKT activation in patients with ovarian carcinoma

Carmela De Marco et al. PLoS One. 2013.

Abstract

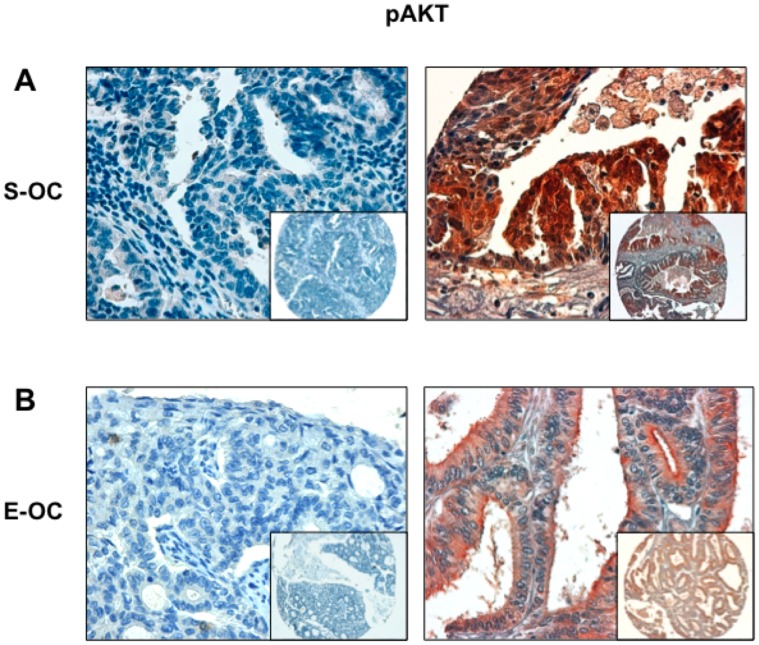
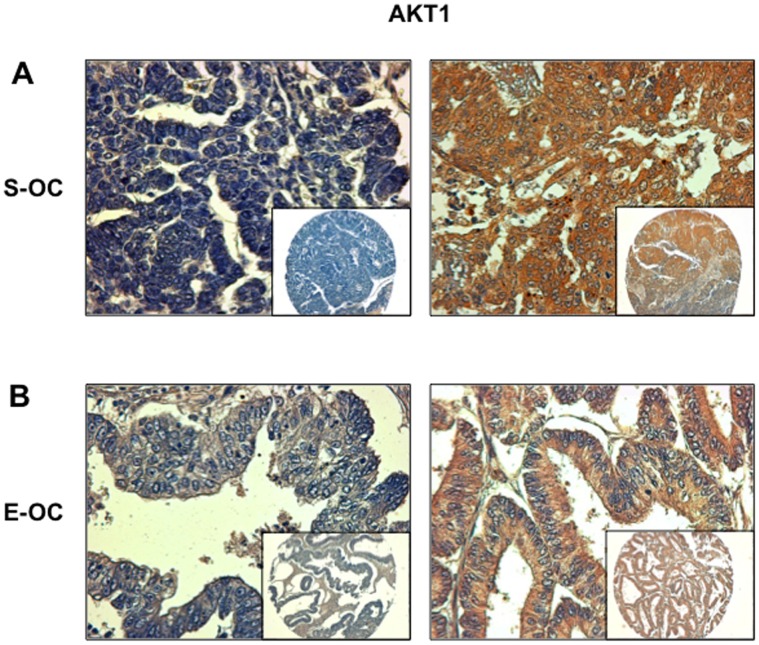
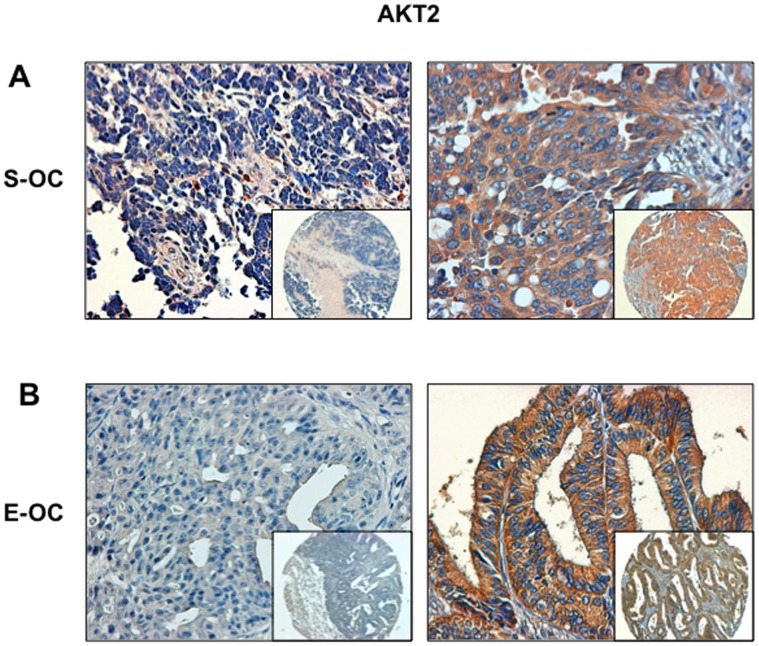
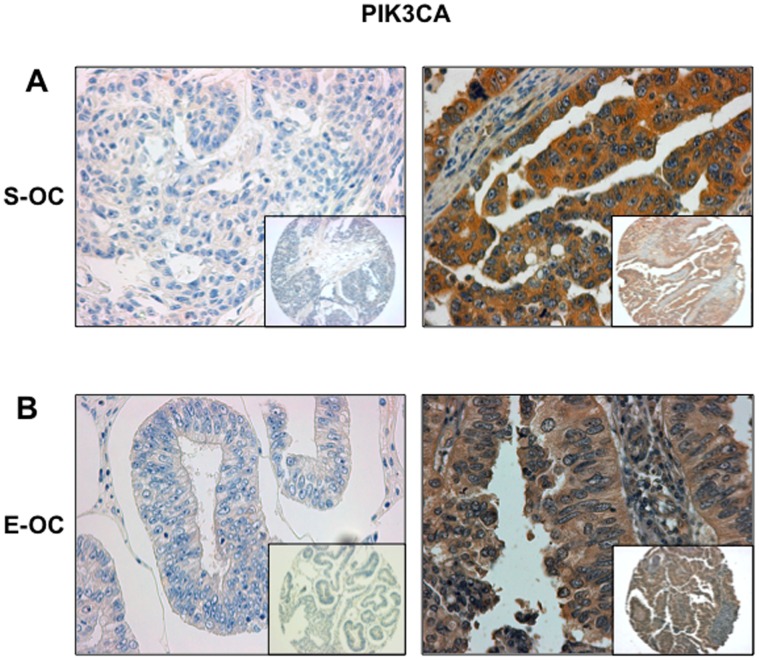
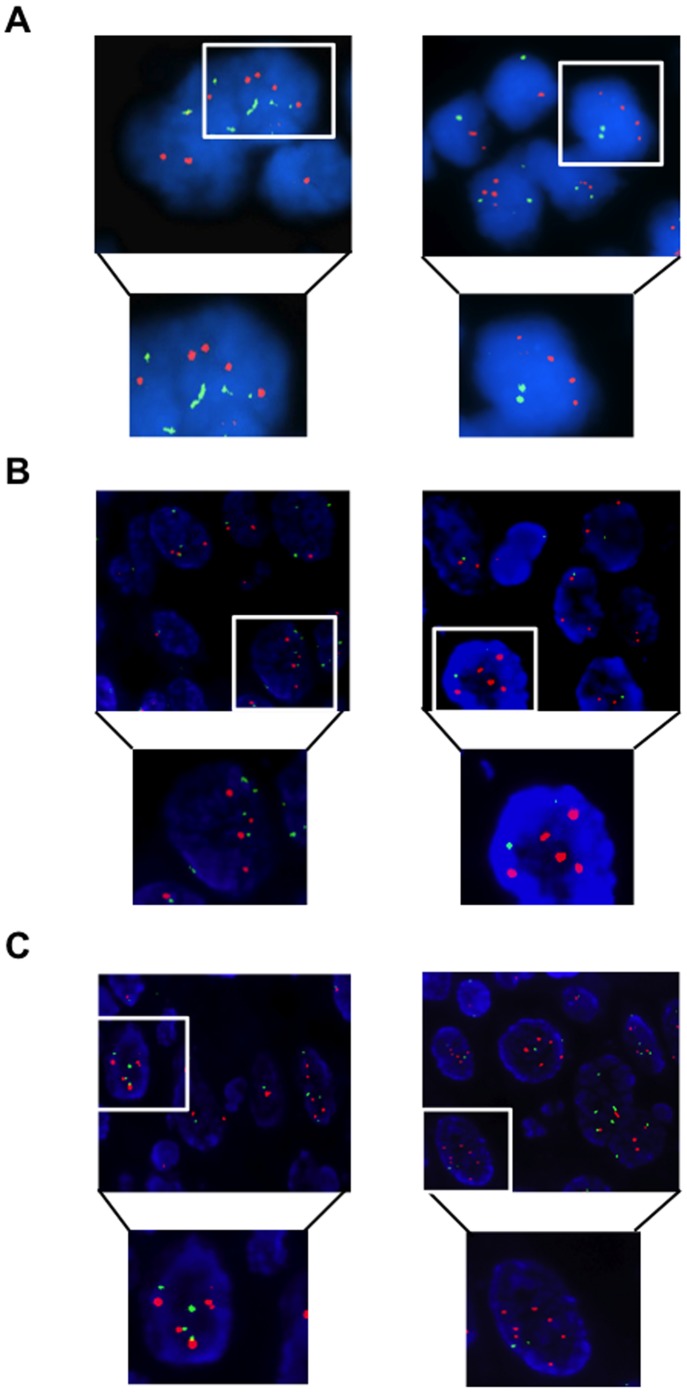
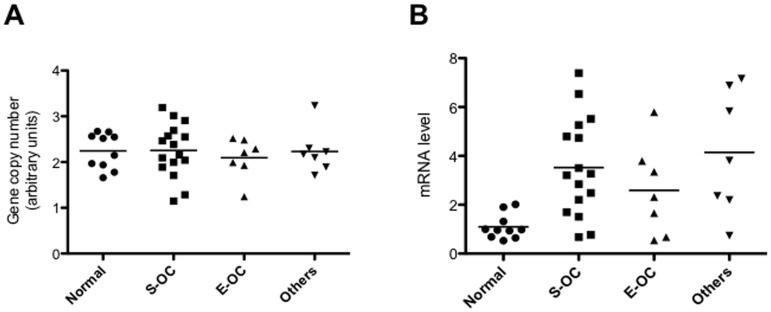
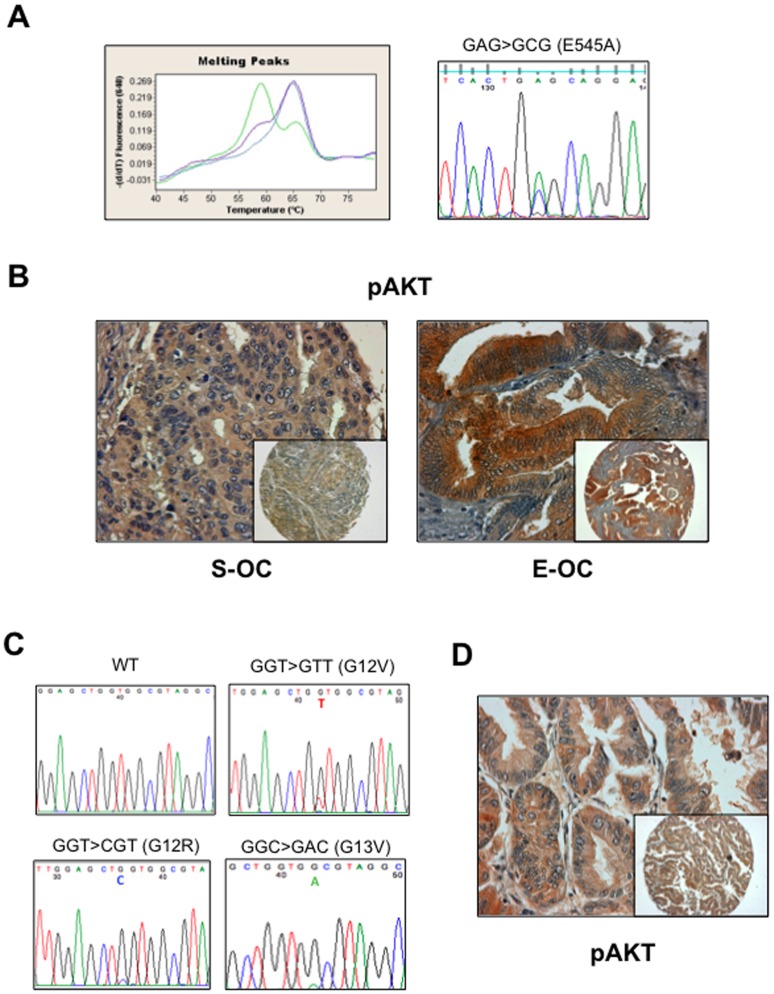
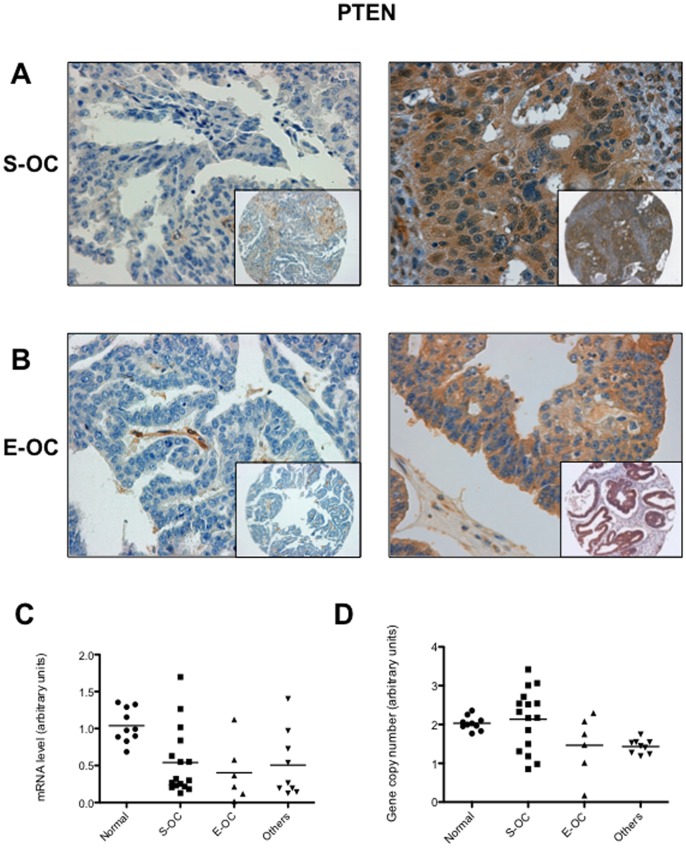
The phosphatidylinositol 3-kinase (PI3K)/AKT pathway is activated in multiple cancers including ovarian carcinoma (OC). However, the relative contribution of the single components within the PI3K pathway to AKT activation in OC is still unclear. We examined 98 tumor samples from Italian OC patients for alterations in the members of the PI3K pathway. We report that AKT is significantly hyperactive in OC compared to normal tissue (n = 93; p<0.0001) and that AKT activation is preferentially observed in the elderly (>58 years old; n = 93; p<0.05). The most frequent alteration is the overexpression of the p110α catalytic subunit of PI3K (63/93, ∼68%); less frequent alterations comprise the loss of PTEN (24/89, 27%) and the overexpression of AKT1 (18/96, 19%) or AKT2 (11/88,12.5%). Mutations in the PIK3CA or KRAS genes were detected at lower frequency (12% and 10%, respectively) whereas mutations in AKT1 or AKT2 genes were absent. Although many tumors presented a single lesion (28/93, of which 23 overexpressed PIK3CA, 1 overexpressed AKT and 4 had lost PTEN), many OC (35/93) presented multiple alterations within the PI3K pathway. Apparently, aberrant PI3K signalling was mediated by activation of the canonical downstream AKT-dependent mTOR/S6K1/4EBP1 pathway and by regulation of expression of oncogenic transcription factors that include HMGA1, JUN-B, FOS and MYC but not by AKT-independent activation of SGK3. FISH analysis indicated that gene amplification of PIK3CA, AKT1 and AKT2 (but not of PI3KR1) and the loss of PTEN are common and may account for changes in the expression of the corresponding proteins. In conclusion, our results indicate that p110α overexpression represents the most frequent alteration within the PI3K/AKT pathway in OC. However, p110α overexpression may not be sufficient to activate AKT signalling and drive ovarian tumorigenesis since many tumors overexpressing PI3K presented at least one additional alteration.


Conflict of interest statement

Competing Interests: The authors have declared that no competing interests exist.

Figures

Figure 1
Figure 1. AKT pS473 immunostaining analysis in OC.
A. Left: S-OC negative for pAKT phosphorylation; right: S-OC positive for pS473 phosphorylation. B. Left: E-OC negative for pAKT phosphorylation; right: E-OC positive for pS473 phosphorylation with apical enhancement. Magnification 40X. Magnification in the insets 10X.
Figure 2
Figure 2. Immunostaining analysis of AKT1 in OC.
A. Left: S-OC negative for AKT1 expression; right: S-OC positive for AKT1 expression. B. Left: E-OC negative for AKT1 expression; right: E-OC positive for AKT1 expression. Magnification 40X. Magnification of the insets 10X.
Figure 3
Figure 3. Immunostaining analysis of AKT2 in OC.
A. Left: S-OC negative for AKT2 expression; right: S-OC positive for AKT2 expression. B. Left: E-OC negative for AKT2 expression; right: E-OC positive for AKT2 expression. Magnification 40X. Magnification of the insets 10X.
Figure 4
Figure 4. Immunostaining analysis of PIK3CA in OC.
A. Left: S-OC negative for PIK3CA expression; right: S-OC positive for PIK3CA expression. B. Left: E-OC negative for PIK3CA expression; right: E-OC positive for PIK3CA expression. Magnification 40X. Magnification of the insets 10X.
Figure 5
Figure 5. FISH analysis of AKT1, AKT2 and PIK3CA genes in OC.
A. Dual-colour fluorescence in situ hybridization analysis of AKT1 gene copy number. AKT1 gene, red signals; chromosome 14 centromere, green signals. Left, OC with cells polyploidy for chromosome 14; right, OC with amplification of the AKT1 locus. Original magnification 100X. B. Dual-colour fluorescence in situ hybridization analysis of AKT2 gene copy number. AKT2 gene, red signals; chromosome region 19p13.1, green signals. Left, OC with cells polyploidy for chromosome 19; right, OC with amplification of the AKT2 locus. Original magnification 100X. C. Dual-colour fluorescence in situ hybridization analysis of PIK3CA gene copy number. PIK3CA gene, red signals; chromosome region 3p14.1, green signals. Left, OC with cells polyploidy for chromosome 3; right, OC with amplification of the PIK3CA locus. Original magnification 100X.
Figure 6
Figure 6. Analysis of the expression and of the gene copy number of PIK3R1.
A. Q-PCR analysis of copy number of the PIK3R1 gene in normal ovarian tissue and OC. DNA from peripheral blood leukocytes (PBL) was used as control. PIK3R1 copy number in PBL was arbitrarly set as 2 (diploid value). B. PIK3R1 mRNA levels in normal ovarian tissue and OC. p = 0.006 (One-way Anova).
Figure 7
Figure 7. Mutation analysis of PIK3CA and KRAS genes in OC.
A. Detection of mutations in PIK3CA by LightCycler (left) and direct sequencing (right). On the left, the negative derivative of the fluorescence (−dF/dT) versus temperature graph shows peaks with different Tm. The wild type sample showed a single Tm at 66°C. The heterozygous mutant sample showed an additional peak at 57°C. On the right, GAG→GCG transition in codon 545 of exon 9 inducing the substitution of a glutammic acid with an alanine (E545A). B. pAKT staining of a mutated S-OC (left) and E-OC (right). C. Point mutations in exon 2 of KRAS gene: GGT→GTT (G12V), GGT→CGT (G12R), GGT→ GAC (G13V). D. pAKT staining of a KRAS mutated sample (MU-6).
Figure 8
Figure 8. Immunostaining and gene copy number analysis of PTEN in OC.
A. Left: S-OC negative for PTEN expression; right: S-OC positive for PTEN expression. B. Left: E-OC negative for PTEN expression; right: E-OC positive for PTEN expression. Magnification 40X. Magnification of the insets 10X. C. Q-RT PCR of PTEN mRNA expression in normal ovarian tissues and OC. D. Q-PCR analysis of PTEN gene copy number in normal ovarian tissues and OC. DNA from peripheral blood leukocytes (PBL) was used as reference. PTEN copy number in PBL was set arbitrarily as 2.
Figure 9
Figure 9. Analysis of pathways activated downstream PI3K in OC: mTOR and SGK3.
A. Immunostaining analysis of phosphorylated AKT, mTOR, S6K1, S6, and 4EBP1 in two representative formalin-fixed samples: left, p110α low (S17) and right, p110α high (S46). B. Protein from fresh-frozen samples were assayed by Western blot with the indicated antibodies. Samples S8, S17, S47, E2: low p110α expression; samples S63, E13: PIK3CA mutation; samples S63, S46, E3: p110α over-expression. Actin expression was used as a control for protein quality and loading. C. Representative pSGK3 immunostaining of pSGK3-positive (upper left panel) and pSGK3-negative (lower left panel) samples. Middle panels, immunostaining analysis of pAKT; right panels, immunostaining analysis of p110α of the same samples. Magnification 40X. Magnification of the insets 10X.
Figure 10
Figure 10. Analysis of pathways activated downstream PI3K in OC: HMGA1, JUN-B, FOS, MYC.
A. Q-RT-PCR analysis of OCs with low or high expression of PIK3CA. B. Q-RT-PCR analysis of HMGA1 (top) and JUN-B (bottom) in OVCA429 (left) and TOV112D (right) treated with LY294002 (LY, 20 µM), RAD001 (RAD, 20nM) or a combination thereof for 24h. Values of mRNA are expressed as relative values using as standard the value of normal ovarian epithelial cells (IOSE 398).

Similar articles

Cited by

References

    1. Fishman DA, Bozorgi K (2001) The scientific basis of early detection of epithelial ovarian cancer: the national ovarian cancer early detection program (NOCEDP). In Cancer Treatment and Research: Ovarian Cancer. In: Stack MS, Fishman DA editors. Boston: Kluwer Academic Publishers. 3–28. - PubMed
    1. Fader AN, Rose PG (2007) Role of surgery in ovarian carcinoma. J Clin Oncol 25: 2873–2883. - PubMed
    1. Levanon K, Crum C, Drapkin R (2008) New insights into the pathogenesis of serous ovarian cancer and its clinical impact. J Clin Oncol 26: 5284–5293. - PMC - PubMed
    1. Auersperg N, Wong AS, Choi KC, Kang SK, Leung PC (2001) Ovarian surface epithelium: biology, endocrinology, and pathology. Endocr Rev 22: 255–288. - PubMed
    1. Feeley KM, Wells M (2001) Precursor lesions of ovarian epithelial malignancy. Histopathology 38: 87–95. - PubMed

Publication types

MeSH terms

Substances