. 2013;8(2):e55439.
doi: 10.1371/journal.pone.0055439. Epub 2013 Feb 8.

Quantitative 1H-NMR-metabolomics reveals extensive metabolic reprogramming and the effect of the aquaglyceroporin FPS1 in ethanol-stressed yeast cells

Affiliations

Quantitative 1H-NMR-metabolomics reveals extensive metabolic reprogramming and the effect of the aquaglyceroporin FPS1 in ethanol-stressed yeast cells

Artur B Lourenço et al. PLoS One. 2013.

Abstract

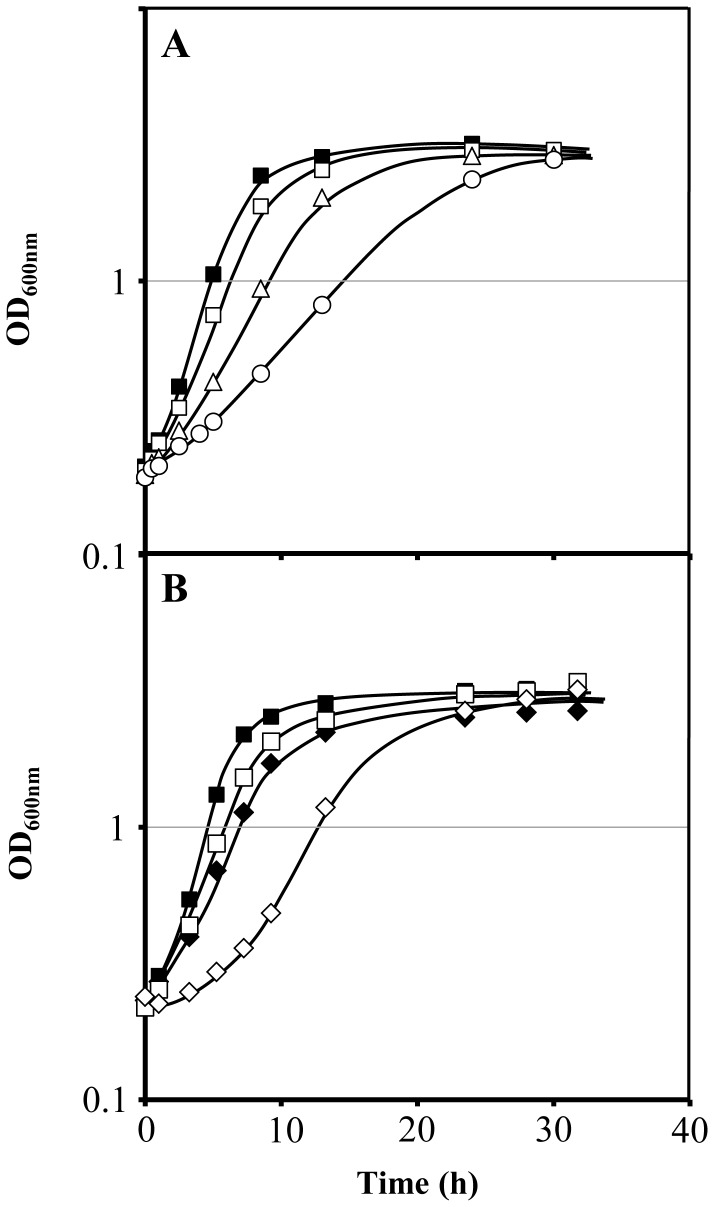
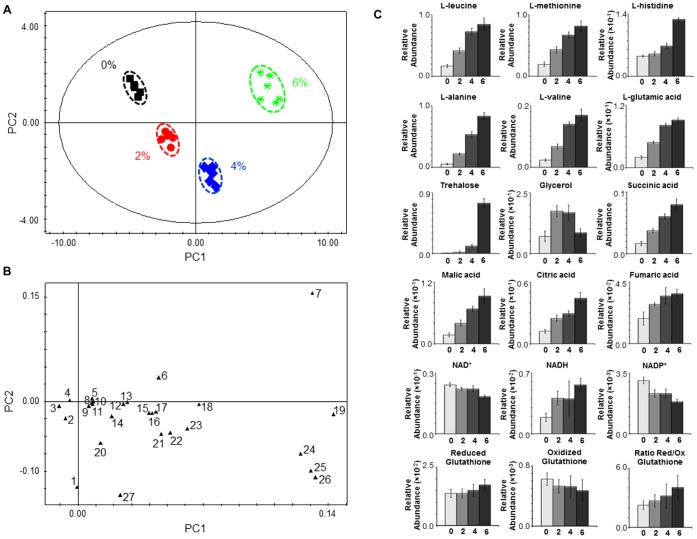
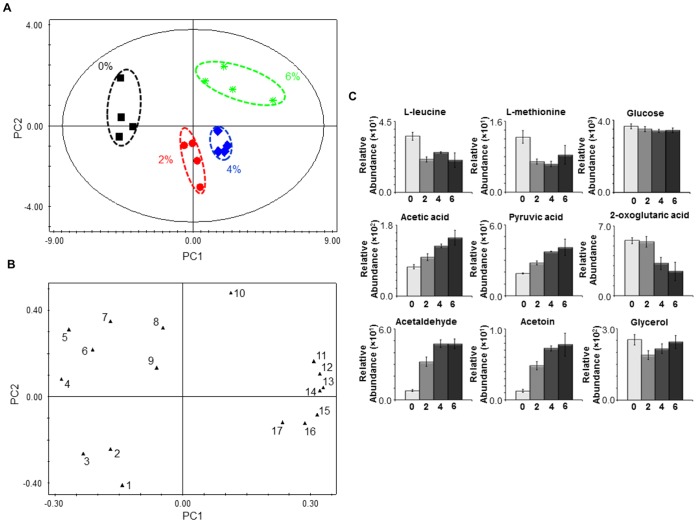
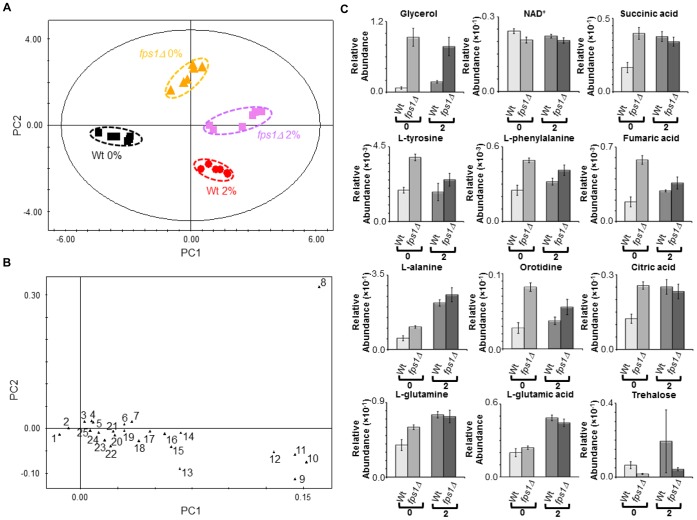
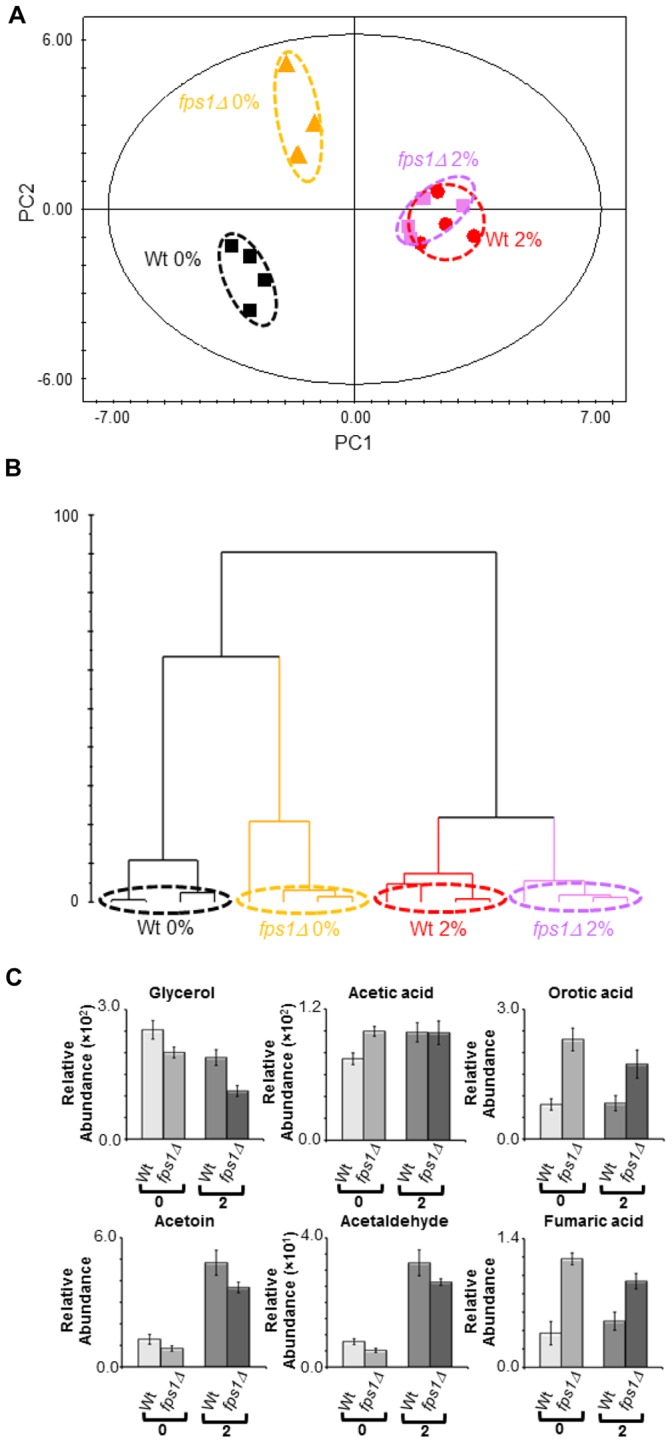
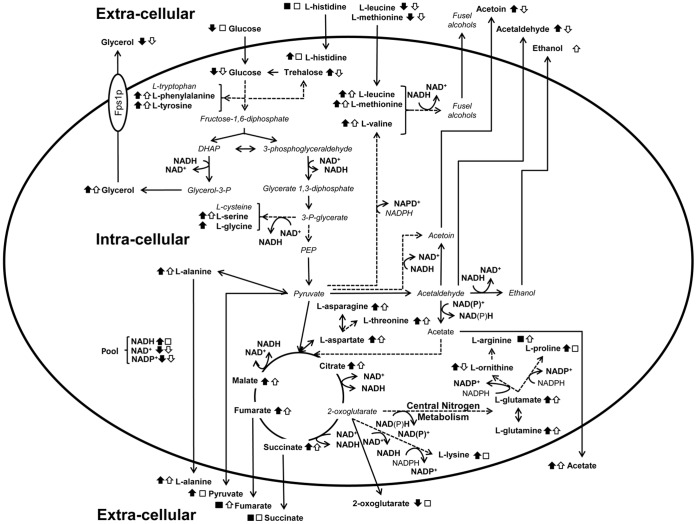
A metabolomic analysis using high resolution 1H NMR spectroscopy coupled with multivariate statistical analysis was used to characterize the alterations in the endo- and exo-metabolome of S. cerevisiae BY4741 during the exponential phase of growth in minimal medium supplemented with different ethanol concentrations (0, 2, 4 and 6% v/v). This study provides evidence that supports the notion that ethanol stress induces reductive stress in yeast cells, which, in turn, appears to be counteracted by the increase in the rate of NAD+ regenerating bioreactions. Metabolomics data also shows increased intra- and extra-cellular accumulation of most amino acids and TCA cycle intermediates in yeast cells growing under ethanol stress suggesting a state of overflow metabolism in turn of the pyruvate branch-point. Given its previous implication in ethanol stress resistance in yeast, this study also focused on the effect of the expression of the aquaglyceroporin encoded by FPS1 in the yeast metabolome, in the absence or presence of ethanol stress. The metabolomics data collected herein shows that the deletion of the FPS1 gene in the absence of ethanol stress partially mimics the effect of ethanol stress in the parental strain. Moreover, the results obtained suggest that the reported action of Fps1 in mediating the passive diffusion of glycerol is a key factor in the maintenance of redox balance, an important feature for ethanol stress resistance, and may interfere with the ability of the yeast cell to accumulate trehalose. Overall, the obtained results corroborate the idea that metabolomic approaches may be crucial tools to understand the function and/or the effect of membrane transporters/porins, such as Fps1, and may be an important tool for the clear-cut design of improved process conditions and more robust yeast strains aiming to optimize industrial fermentation performance.


Conflict of interest statement

Competing Interests: The authors have declared that no competing interests exist.

Figures

Figure 1
Figure 1. Growth curves of S. cerevisiae BY4741 parental strain and fps1Δ deletion mutant under ethanol stress.
(A) Comparison of the growth curves of S. cerevisiae BY4741 in the absence (▪) or presence of 2% v/v (□), 4% v/v (Δ) and 6% v/v (○) of ethanol. (B) Comparison of the growth curves of S. cerevisiae BY4741 (▪, □) and the corresponding deletion mutant fps1Δ (♦, ◊) in the absence (closed symbols) or presence of 2% v/v of ethanol (open symbols).
Figure 2
Figure 2. Endo-metabolome analysis of S. cerevisiae BY4741 parental strain under ethanol stress.
Yeast cells were harvested during the exponential phase of growth (OD600 nm = 1.0) in the same basal medium and supplemented with different ethanol concentrations (% v/v). (A) 2D score plot displaying the space formed by the two first principal components (R2X for PC1 equal to 0.792 and R2X for PC2 equal to 0.129), (B) 2D loading plot displaying the space formed by the two first principal components and presenting the characteristic bins for a set of metabolites and (C) Relative abundance of different metabolites in the endo-metabolome of S. cerevisiae BY4741 cells harvested during the exponential phase of growth (OD600 nm = 1.0) in the presence of different ethanol concentrations (0, 2, 4 and 6% v/v). Each plot displays the variation in the relative abundance of a representative bin in the spectrum for each amino acid. Experimental values are means of six independent experiments with standard deviation error bars. Key: 1 Glycerol, 2 L-arginine, 3 NAD+, 4 NADP+, 5 L-tyrosine, 6 L-histidine, 7 Trehalose, 8 NADH, 9 Fumaric acid, 10 L-proline, 11 L-phenylalanine, 12 L-asparagine, 13 Citric acid, 14 L-serine, 15 Succininic acid, 16 L-aspartic acid, 17 Malic acid, 18 L-glutamine, 19 L-alanine, 20 L-lysine, 21 L-glycine, 22 L-threonine, 23 L-valine, 24 L-methionine, 25 L-leucine, 26 L-glutamic acid and 27 L-ornithine.
Figure 3
Figure 3. Exo-metabolome analysis of S. cerevisiae BY4741 parental strain under ethanol stress.
Samples were collected during the exponential phase of growth (OD600 nm = 1.0) in the same basal medium supplemented with different ethanol concentrations (% v/v). (A) 2D score plot displaying the space formed by the two first principal components (R2X for PC1 equal to 0.522 and R2X for PC2 equal to 0.166), (B) 2D loading plot displaying the space formed by the two first principal components and presenting the characteristic bins for a set of metabolites and (C) relative abundance of different metabolites in the exo-metabolome of S. cerevisiae BY4741 cells during the exponential phase of growth (OD600 nm = 1.0) in the presence of different ethanol concentrations (0, 2, 4 and 6% v/v). Experimental values are means of four independent experiments with standard deviation error bars. Key: 1 Orotic acid, 2 Succininc acid, 3 2-Oxoglutaric acid, 4 L-leucine, 5 L-methionine, 6 Glucose, 7 L-histidine, 8 Glycerol, 9 Formic acid, 10 Uracil, 11 Acetic acid, 12 Pyruvic acid, 13 Acetoin, 14 Acetaldehyde, 15 Lactic acid, 16 L-alanine and 17 Fumaric acid.
Figure 4
Figure 4. Comparison between the endo-metabolome of BY4741 parental strain and of fps1Δ deletion mutant.
Yeast cells were harvested during the exponential phase of growth (OD600 nm = 1.0) in the same basal medium supplemented with 0 or 2% v/v of ethanol. (A) 2D score plot displaying the space formed by the two first principal components (R2X for PC1 equal to 0.525 and R2X for PC2 equal to 0.321), (B) 2D loading plot displaying the space formed by the two first principal components (with characteristic bins for a set of metabolites) and (C) relative abundances of different metabolites in the endo-metabolome of the parental strain and the fps1Δ deletion strain during the exponential growth phase (OD600 nm = 1.0) in the presence of different ethanol concentrations (0 and 2% v/v). Experimental values are means of six independent experiments with standard deviation error bars. Key: 1 NAD+, 2 NADP+, 3 L-tyrosine, 4 Fumaric acid, 5 L-phenylalanine, 6 Citric acid, 7 Succininic acid, 8 Glycerol, 9 L-glutamic acid, 10 L-leucine, 11 L-methionine, 12 L-alanine, 13 L-ornithine, 14 L-threonine, 15 L-valine,16 L-glutamine, 17 L-aspartic acid, 18 L-malic acid, 19 L-histidine, 20 L-serine, 21 L-asparagine, 22 L-lysine, 23 Thiamine, 24 NADH and 25 L-proline.
Figure 5
Figure 5. Comparison between the exo-metabolome of BY4741 parental strain and of fps1Δ deletion mutant.
Samples were collected during the exponential phase of growth (OD600 nm = 1.0) in the same basal medium supplemented with 0 or 2% v/v of ethanol. (A) 2D score plot displaying the space formed by the two first principal components (R2X for PC1 equal to 0.375 and R2X for PC2 equal to 0.284), (B) dendrogram based on the PCA scores (ward clustering distance measure) considering all principal components of the model and (C) relative abundances of different metabolites in the exo-metabolome of the parental strain and the fps1Δ deletion mutant during the exponential growth phase (OD600 nm = 1.0) in the presence of different ethanol concentrations (0 and 2% v/v). Experimental values are means of four independent experiments with standard deviation error bars.
Figure 6
Figure 6. Integrative overview of the metabolic changes occurring under ethanol stress or upon FPS1 deletion.
Changes found to occur (as indicated by the black or white arrows) or not (□,▪) in yeast cells growing in the presence of inhibitory concentrations of ethanol (closed symbols), or upon FPS1 deletion (open symbols) are shown. The metabolic scheme was based on information gathered in the KEGG PATHWAY Database (http://www.genome.jp/kegg/pathway.html) and in Yeast Biochemical Pathway Database (http://pathway.yeastgenome.org/).

Similar articles

Cited by

References

    1. Gibson BR, Lawrence SJ, Leclaire JP, Powell CD, Smart KA (2007) Yeast responses to stresses associated with industrial brewery handling. FEMS Microbiology Reviews 31: 535–569. - PubMed
    1. Stanley D, Chambers PJ, Stanley GA, Borneman A, Fraser S (2010) Transcriptional changes associated with ethanol tolerance in Saccharomyces cerevisiae . Applied Microbiology and Biotechnology 88: 231–239. - PubMed
    1. van Uden N (1985) Ethanol toxicity and ethanol tolerance in yeasts. Annual Reports on Fermentation Processes 8: 11–58.
    1. Gawel R, Francis L, Waters EJ (2007) Statistical correlations between the in-mouth textural characteristics and the chemical composition of Shiraz wines. Journal of Agriculture Food and Chemistry 55: 2683–2687. - PubMed
    1. Gawel R, van Sluyter S, Waters EJ (2007) The effects of ethanol and glycerol on the body and other sensory characteristics of Riesling wines. Australian Journal of Grape and Wine Research 13: 38–45.

Publication types

MeSH terms