

Relationship between plasma analytes and SPARE-AD defined brain atrophy patterns in ADNI
- PMID: 23408997
- PMCID: PMC3568142
- DOI: 10.1371/journal.pone.0055531
Relationship between plasma analytes and SPARE-AD defined brain atrophy patterns in ADNI
Abstract
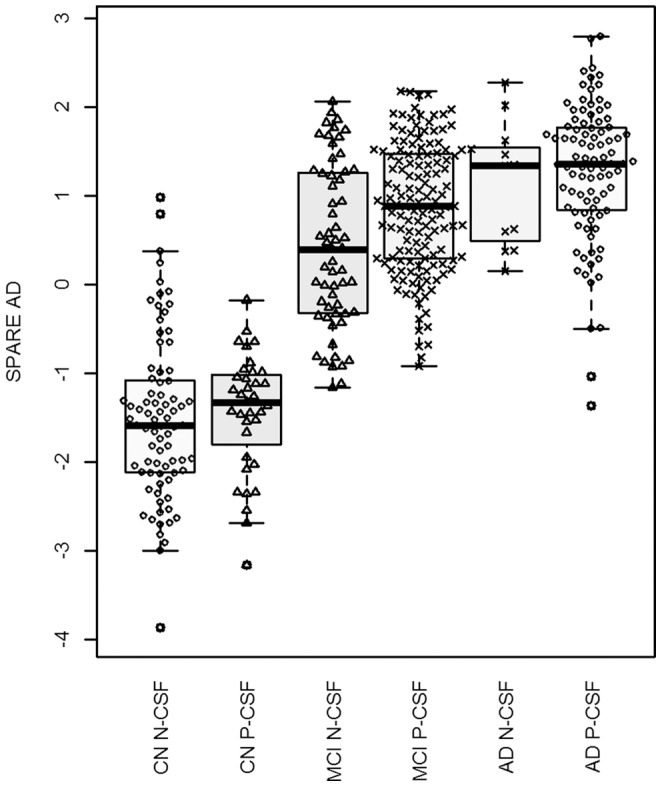
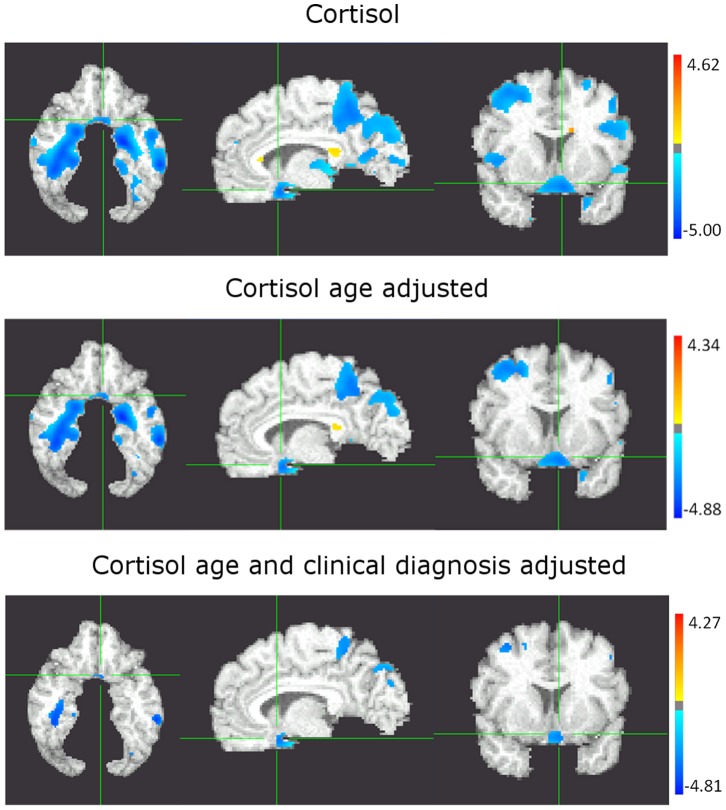
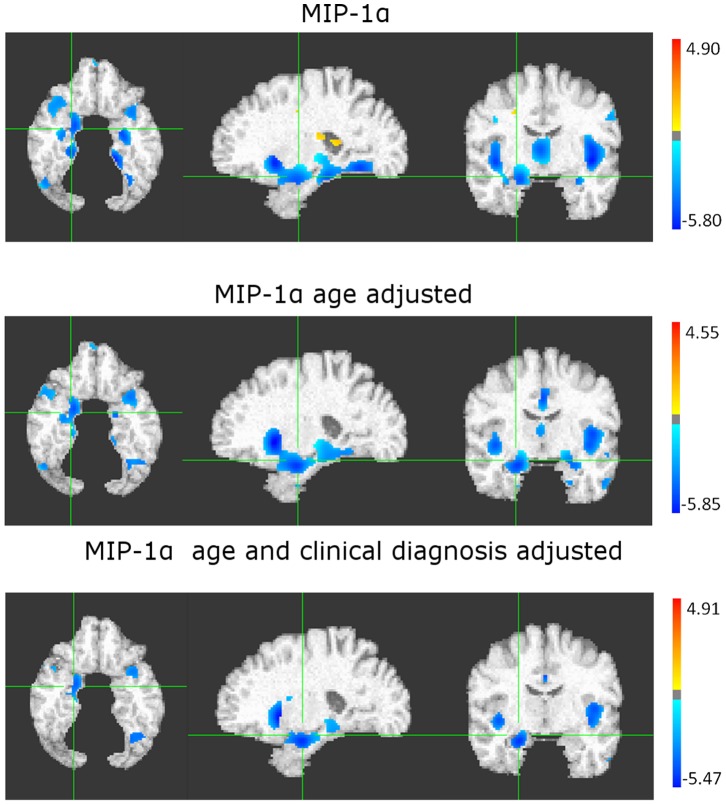
Different inflammatory and metabolic pathways have been associated with Alzheimeŕs disease (AD). However, only recently multi-analyte panels to study a large number of molecules in well characterized cohorts have been made available. These panels could help identify molecules that point to the affected pathways. We studied the relationship between a panel of plasma biomarkers (Human DiscoveryMAP) and presence of AD-like brain atrophy patterns defined by a previously published index (SPARE-AD) at baseline in subjects of the ADNI cohort. 818 subjects had MRI-derived SPARE-AD scores, of these subjects 69% had plasma biomarkers and 51% had CSF tau and Aβ measurements. Significant analyte-SPARE-AD and analytes correlations were studied in adjusted models. Plasma cortisol and chromogranin A showed a significant association that did not remain significant in the CSF signature adjusted model. Plasma macrophage inhibitory protein-1α and insulin-like growth factor binding protein 2 showed a significant association with brain atrophy in the adjusted model. Cortisol levels showed an inverse association with tests measuring processing speed. Our results indicate that stress and insulin responses and cytokines associated with recruitment of inflammatory cells in MCI-AD are associated with its characteristic AD-like brain atrophy pattern and correlate with clinical changes or CSF biomarkers.
Conflict of interest statement
Figures

Similar articles
-
Insulin-like growth factor binding protein-2 interactions with Alzheimer's disease biomarkers.Brain Imaging Behav. 2017 Dec;11(6):1779-1786. doi: 10.1007/s11682-016-9636-0. Brain Imaging Behav. 2017. PMID: 27817134 Free PMC article.
-
Longitudinal structural cerebral changes related to core CSF biomarkers in preclinical Alzheimer's disease: A study of two independent datasets.Neuroimage Clin. 2018 Apr 16;19:190-201. doi: 10.1016/j.nicl.2018.04.016. eCollection 2018. Neuroimage Clin. 2018. PMID: 30023169 Free PMC article.
-
Inverse association of cortisol serum levels with T-tau, P-tau 181 and P-tau 231 peptide levels and T-tau/Abeta 1-42 ratios in CSF in patients with mild Alzheimer's disease dementia.Eur Arch Psychiatry Clin Neurosci. 2009 Mar;259(2):80-5. doi: 10.1007/s00406-008-0838-3. Epub 2008 Sep 19. Eur Arch Psychiatry Clin Neurosci. 2009. PMID: 18806919
-
The Alzheimer's Disease Neuroimaging Initiative: a review of papers published since its inception.Alzheimers Dement. 2013 Sep;9(5):e111-94. doi: 10.1016/j.jalz.2013.05.1769. Epub 2013 Aug 7. Alzheimers Dement. 2013. PMID: 23932184 Free PMC article. Review.
-
Amyloid beta protein and tau in cerebrospinal fluid and plasma as biomarkers for dementia: a review of recent literature.Curr Clin Pharmacol. 2008 May;3(2):123-31. doi: 10.2174/157488408784293723. Curr Clin Pharmacol. 2008. PMID: 18700307 Review.
Cited by
-
Neuroanatomical classification in a population-based sample of psychotic major depression and bipolar I disorder with 1 year of diagnostic stability.Biomed Res Int. 2014;2014:706157. doi: 10.1155/2014/706157. Epub 2014 Jan 19. Biomed Res Int. 2014. PMID: 24575411 Free PMC article.
-
Metabolic network failures in Alzheimer's disease: A biochemical road map.Alzheimers Dement. 2017 Sep;13(9):965-984. doi: 10.1016/j.jalz.2017.01.020. Epub 2017 Mar 22. Alzheimers Dement. 2017. PMID: 28341160 Free PMC article.
-
Insulin-like growth factor binding protein-2 in at-risk adults and autopsy-confirmed Alzheimer brains.Brain. 2024 May 3;147(5):1680-1695. doi: 10.1093/brain/awad398. Brain. 2024. PMID: 37992295 Free PMC article.
-
Memory, executive, and multidomain subtle cognitive impairment: clinical and biomarker findings.Neurology. 2015 Jul 14;85(2):144-53. doi: 10.1212/WNL.0000000000001738. Epub 2015 Jun 17. Neurology. 2015. PMID: 26085606 Free PMC article.
-
Using high-dimensional machine learning methods to estimate an anatomical risk factor for Alzheimer's disease across imaging databases.Neuroimage. 2018 Dec;183:401-411. doi: 10.1016/j.neuroimage.2018.08.040. Epub 2018 Aug 18. Neuroimage. 2018. PMID: 30130645 Free PMC article.
References
-
- Hyman BT, Trojanowski JQ (1997) Consensus recommendations for the postmortem diagnosis of Alzheimer disease from the National Institute on Aging and the Reagan Institute Working Group on diagnostic criteria for the neuropathological assessment of Alzheimer disease. J Neuropathol Exp Neurol 56: 1095–1097. - PubMed
-
- Khachaturian ZS (1985) Diagnosis of Alzheimer’s disease. Arch Neurol 42: 1097–1105. - PubMed
-
- Braak H, Braak E (1991) Neuropathological stageing of Alzheimer-related changes. Acta Neuropathol 82: 239–259. - PubMed
-
- Mirra SS, Heyman A, McKeel D, Sumi SM, Crain BJ, et al. (1991) The Consortium to Establish a Registry for Alzheimer’s Disease (CERAD). Part II. Standardization of the neuropathologic assessment of Alzheimer’s disease. Neurology 41: 479–486. - PubMed
Publication types
MeSH terms
Substances
Grants and funding
LinkOut - more resources
Full Text Sources
Other Literature Sources
Medical
Research Materials
