. 2013;8(2):e55817.
doi: 10.1371/journal.pone.0055817. Epub 2013 Feb 8.

Alterations in the colonic microbiota in response to osmotic diarrhea

Affiliations

Alterations in the colonic microbiota in response to osmotic diarrhea

Gregor Gorkiewicz et al. PLoS One. 2013.

Abstract

Background & aims: Diseases of the human gastrointestinal (GI) tract are often accompanied by diarrhea with profound alterations in the GI microbiota termed dysbiosis. Whether dysbiosis is due to the disease itself or to the accompanying diarrhea remains elusive. With this study we characterized the net effects of osmotic diarrhea on the composition of the GI microbiota in the absence of disease.

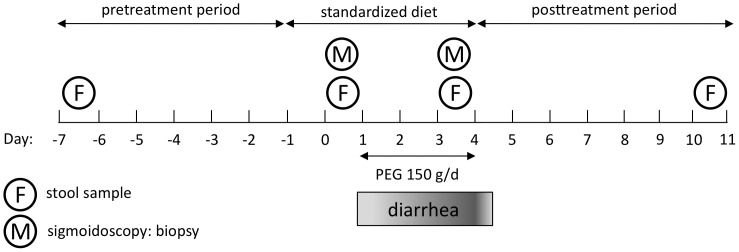
Methods: We induced osmotic diarrhea in four healthy adults by oral administration of polyethylene glycol 4000 (PEG). Stool as well as mucosa specimens were collected before, during and after diarrhea and 16S rDNA-based microbial community profiling was used to assess the microbial community structure.

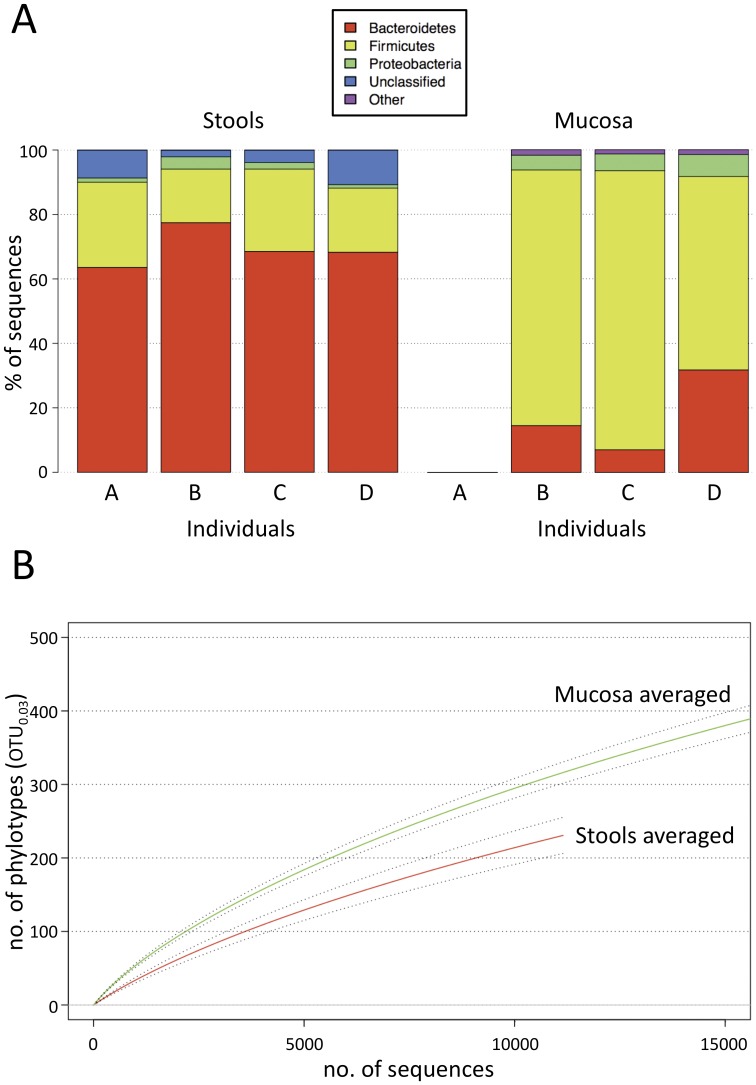
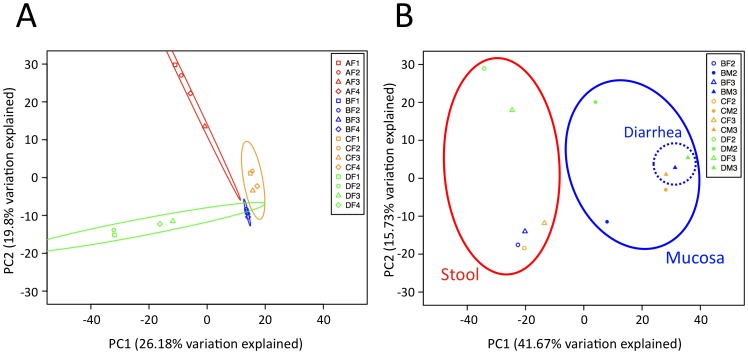
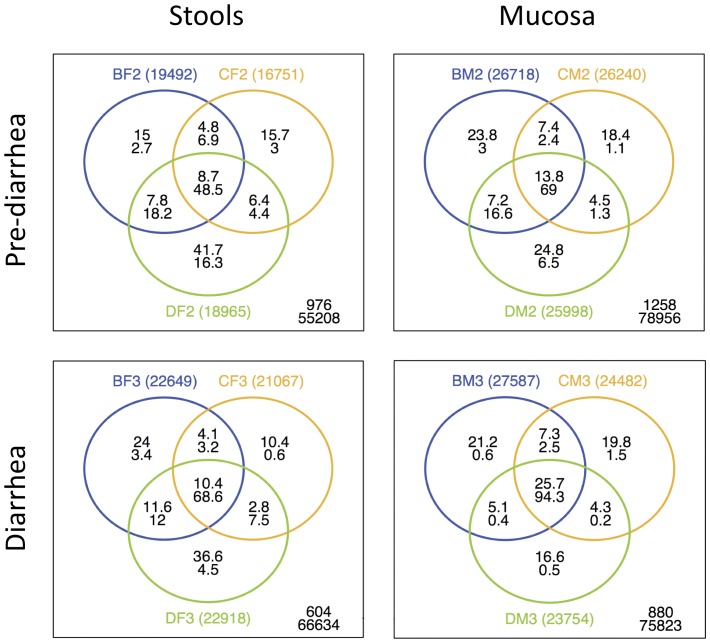
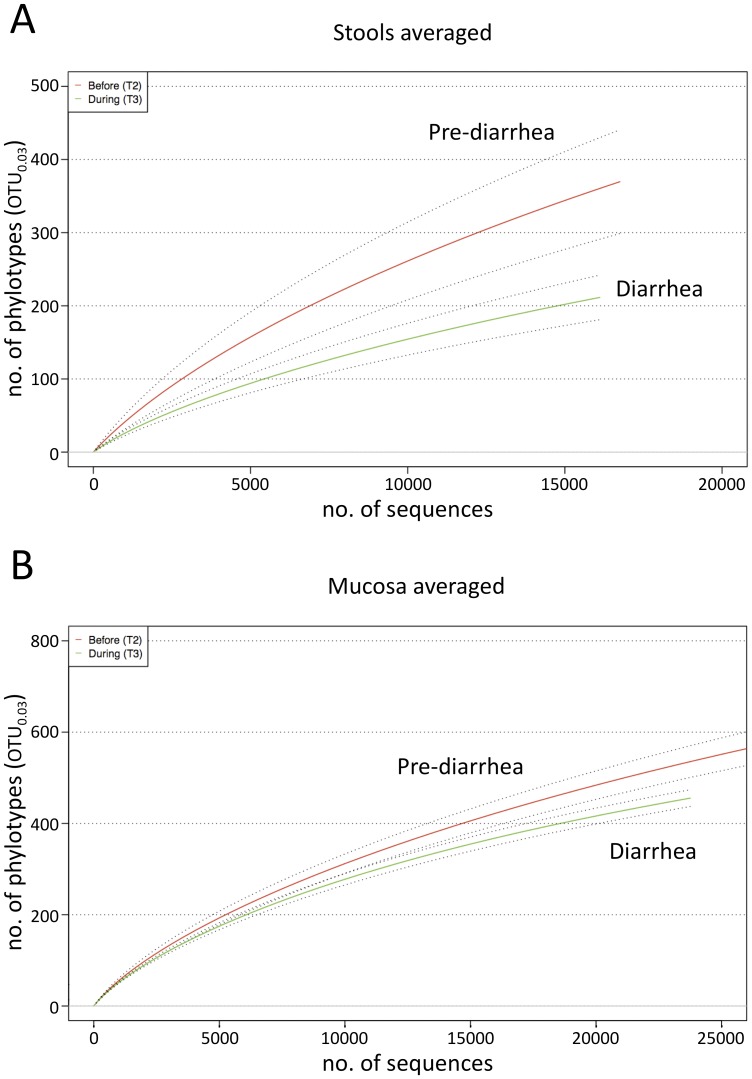
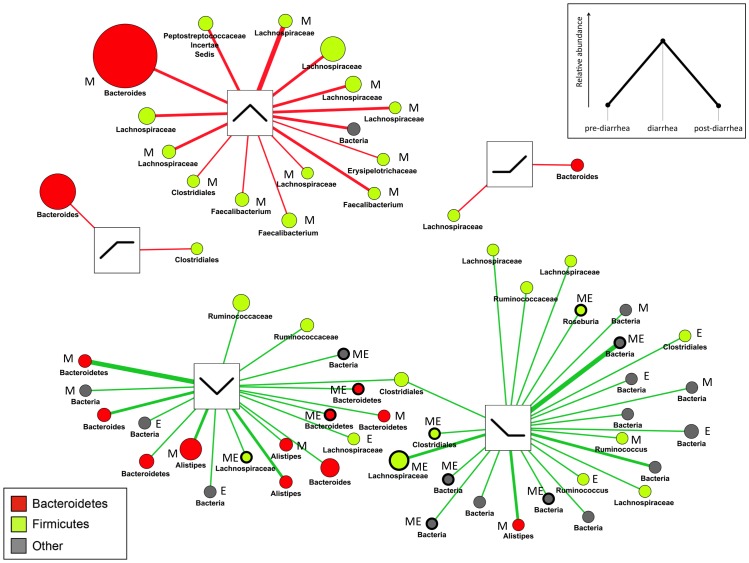
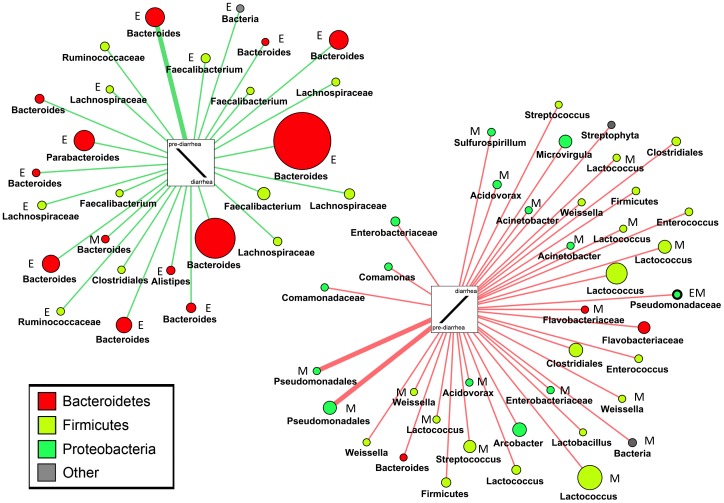
Results: Stool and mucosal microbiotas were strikingly different, with Firmicutes dominating the mucosa and Bacteroidetes the stools. Osmotic diarrhea decreased phylotype richness and showed a strong tendency to equalize the otherwise individualized microbiotas on the mucosa. Moreover, diarrhea led to significant relative shifts in the phyla Bacteroidetes and Firmicutes and to a relative increase in the abundance of Proteobacteria on the mucosa, a phenomenon also noted in several inflammatory and diarrheal GI diseases.

Conclusions: Changes in microbial community structure induced by osmotic diarrhea are profound and show similarities to changes observed in other GI diseases including IBD. These effects so must be considered when specimens from diarrheal diseases (i.e. obtained by stratification of samples according to diarrheal status) or conditions wherein bowel preparations like PEG (i.e. specimens obtained during endoscopy) are used.


Conflict of interest statement

Competing Interests: The authors have declared that no competing interests exist.

Figures

Figure 1
Figure 1. Study design.
Subjects were on a free diet from day –7 to day –2 and from day 4 to day 10. From day −1 to day 0 a standardized diet was ingested. Diarrhea was induced by PEG for 3 days (day 1 to day 3). One stool sample was obtained one week before induction of diarrhea. Before the first dose of PEG a second stool sample and a mucosa sample were collected. A third stool and a second mucosa sample were taken at day three of PEG administration when diarrhea was maximally pronounced. A fourth stool sample was taken one week after withdrawal of PEG.
Figure 2
Figure 2. Different community structure and richness in stool and mucosa specimens.
(A) Relative phylum distribution in stool (individual A, B, C, D) and mucosa specimens (individual B, C, D) from pooled data from each individual. “Unclassified” denotes phylotypes that were only assigned to the bacterial domain by using the 80% identity threshold for RDP classifications. “Other” denotes phyla prevalent below 2%. (B) Rarefaction analysis of averaged mucosa (green) and stool (red) samples (OTU distance = 0.03). The dotted line indicates ± SEM.
Figure 3
Figure 3. Stool microbiotas are highly individualized and mucosal microbiotas assimilate due to osmotic diarrhea.
(A) PCA of stool samples according to individuals and treatment periods shows individual specific clustering of stool samples. The principal components 1 & 2 accounting for up to 26.18% variability are shown including 87% confidence ellipses. The inset panels identify the respective samples (A, B, C, D denote subjects; F denotes stool sample; M denotes mucosa sample; time-points: 1, 2 pre-diarrhea, 3 diarrhea, 4 post-diarrhea). (B) PCA of stool and the corresponding mucosa samples before and during diarrhea. The principal components 1 & 2 accounting for up to 41.67% variability are shown. Stool and mucosal communities are significantly different (P = 0.0002, Student’s t-test) and are clearly separated from each other. Mucosal communities obtained before (time-point 2) and during diarrhea (time-point 3) are significantly different (P = 0.0044, Student’s t-test) and cluster independent of the individual, indicating a convergence of the individualized microbiotas.
Figure 4
Figure 4. The number of shared phylotypes between individuals increases due to osmotic diarrhea.
The number of shared phylotypes (OTU distance = 0.03) between individuals increases during diarrhea in stools (left) but more pronouncedly in mucosa (right) samples (8.7–10.4% vs. 13.8–25.7%). The figure indicates the relative (%) phylotype (upper number) and sequence overlap (lower number) of stool (F) and mucosa (M) samples of individuals B, C and D at time-point 2 (top) and time-point 3 (bottom).
Figure 5
Figure 5. Osmotic diarrhea leads to decreased phylotype richness.
(A) Rarefaction analysis of averaged stool samples before (time-point 2, red) and during diarrhea (time-point 3, green) shows significantly decreased richness (richness time-point 2 vs. time point 3: P = 0.029, Student’s t-test). (B) Rarefaction analysis of averaged mucosa samples before (time-point 2, red) and during diarrhea (time-point 3, green) shows a trend toward but non-significant decrease in richness (richness time-point 2 vs. time point 3: P = 0.08 Student’s t-test). The dotted line indicates ± SEM; OTU distance = 0.03.
Figure 6
Figure 6. Consistency of measures.
Congruence of Metastats, edgeR and Viz (denoted “Profile”; in at least two individuals simultaneously) for identification of significantly changing OTUs (diversity = 0.03) in stool samples (A) and mucosa samples (B).
Figure 7
Figure 7. Changing stool OTUs visualized with an association network (Viz).
OTUs (distance = 0.03) are shown with their respective progression patterns during the study (i.e. abundance change; boxes in the center). The inset exemplifies one possible abundance progression showing an increasing-decreasing pattern. Only OTUs are displayed that were assigned to a respective reaction pattern in at least two individuals (corresponding to thin lines connecting OTUs with their pattern). The width of lines correlates with the number of individuals in whom an OTU was assigned to a specific pattern. Size of nodes correlates with the sum of changes during the study period (mean relative abundance change comparing pre-diarrhea to diarrhea and diarrhea to post-diarrhea samples). OTUs are colored according to their phylum membership and named according to the taxonomic rank conferred by the RDP classifier (80% identity threshold). M denotes significantly changed according to Metastats analysis (P<0.05); E denotes significantly changed according to edgeR analysis (P<0.05). OTUs identified by both biostatistical methods are highlighted with a bold outline. Note the increase of Faecalibacterium due to diarrhea (upper left) and the skew of edgeR-identified phylotypes towards decreasing patterns (bottom).
Figure 8
Figure 8. Changing mucosal OTUs visualized with an association network (Viz).
OTUs (distance = 0.03) are shown with their respective abundance change comparing pre-diarrhea (time-point 2) with diarrhea (time-point 3) samples. Only OTUs are displayed that were assigned to a respective reaction pattern in at least two individuals (corresponding to thin lines). The width of lines correlates with the number of individuals in whom an OTU was assigned to a specific pattern. Size of nodes correlates with the mean relative abundance change comparing pre-diarrhea to diarrhea samples. OTUs are colored according to their phylum membership and named according to the taxonomic rank conferred by the RDP classifier (80% identity threshold). M denotes significantly changed according to Metastats analysis (P<0.05); E denotes significantly changed according to edgeR analysis (P<0.05). OTUs identified by both biostatistical methods are highlighted with a bold outline. Note the increase of various Proteobacteria, including opportunistic pathogens (e.g. Pseudomonas, Acinetobacter, Arcobacter), and also an increase of Firmicutes due to diarrhea (right); Bacteroidetes generally occurred together with Faecalibacterium, which was mirrored by an increase in stools. Note the skew of edgeR-identified OTUs towards the decreasing pattern (left) and of Metastats identified OTUs towards the increasing pattern (right).

Similar articles

Cited by

References

    1. Turnbaugh PJ, Ley RE, Hamady M, Fraser-Liggett CM, Knight R, et al. (2007) The Human Microbiome Project. Nature 449: 804–810. - PMC - PubMed
    1. Costello EK, Lauber CL, Hamady M, Fierer N, Gordon JI, et al. (2009) Bacterial Community Variation in Human Body Habitats Across Space and Time. Science 326: 1694–1697. - PMC - PubMed
    1. Turnbaugh PJ, Gordon JI (2009) The core gut microbiome, energy balance and obesity. J Physiol (Lond) 587: 4153–4158. - PMC - PubMed
    1. Chow J, Lee SM, Shen Y, Khosravi A, Mazmanian SK (2010) Host-Bacterial Symbiosis in Health and Disease. Adv Immunol 107: 243–274. - PMC - PubMed
    1. Frank DN, Amand ALS, Feldman RA, Boedeker EC, Harpaz N, et al. (2007) Molecular-phylogenetic characterization of microbial community imbalances in human inflammatory bowel diseases. Proc Natl Acad Sci U S A 104: 13780–13785. - PMC - PubMed

Publication types

Substances