. 2013;8(2):e55959.
doi: 10.1371/journal.pone.0055959. Epub 2013 Feb 11.

In vivo imaging with fluorescent smart probes to assess treatment strategies for acute pancreatitis

Affiliations

In vivo imaging with fluorescent smart probes to assess treatment strategies for acute pancreatitis

Abhiruchi Agarwal et al. PLoS One. 2013.

Abstract

Background and aims: Endoprotease activation is a key step in acute pancreatitis and early inhibition of these enzymes may protect from organ damage. In vivo models commonly used to evaluate protease inhibitors require animal sacrifice and therefore limit the assessment of dynamic processes. Here, we established a non-invasive fluorescence imaging-based biomarker assay to assess real-time protease inhibition and disease progression in a preclinical model of experimental pancreatitis.

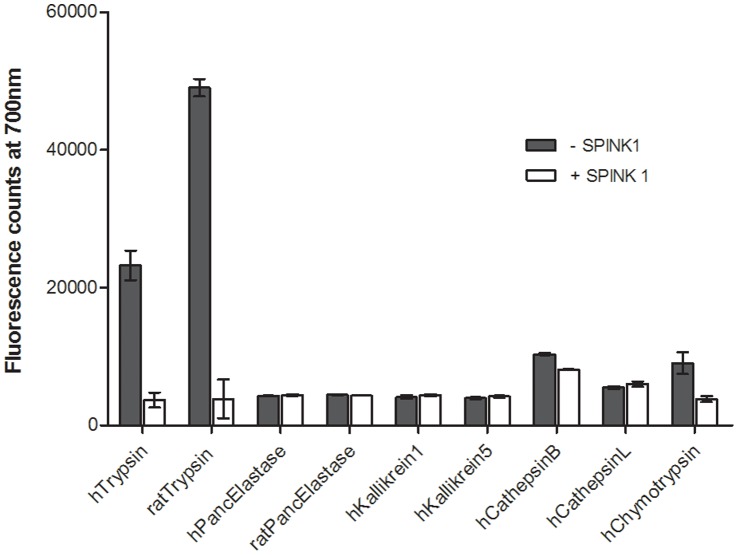
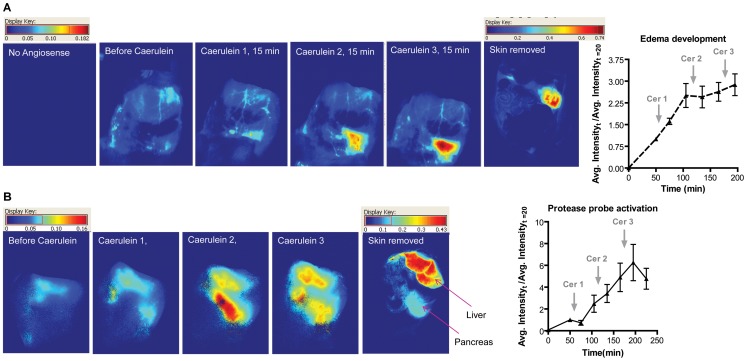
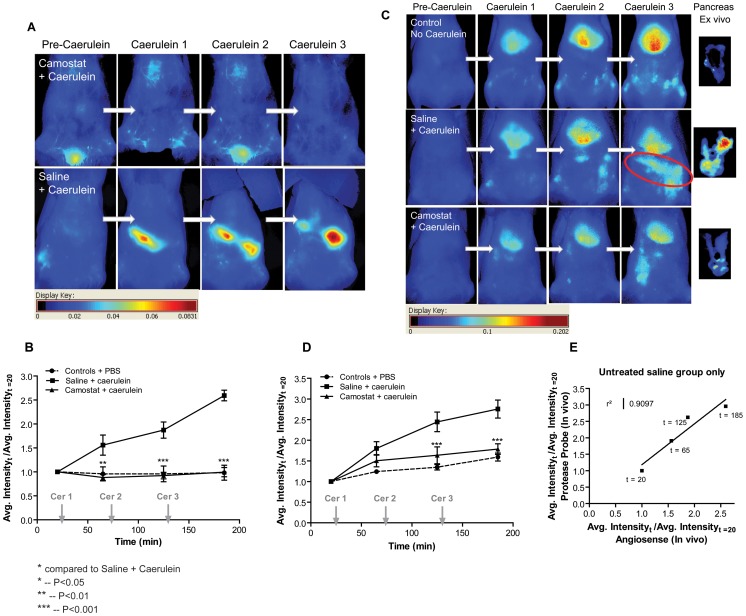
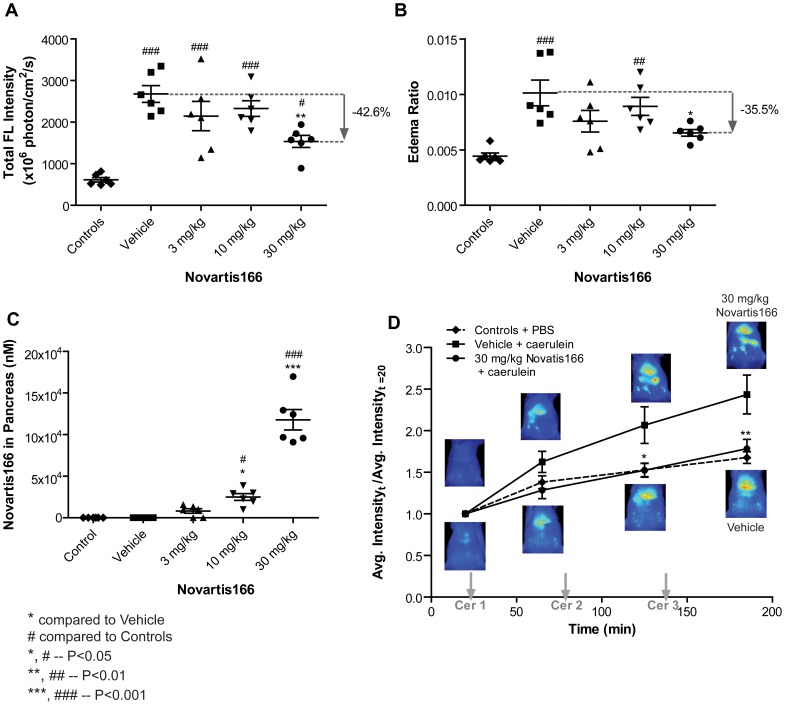
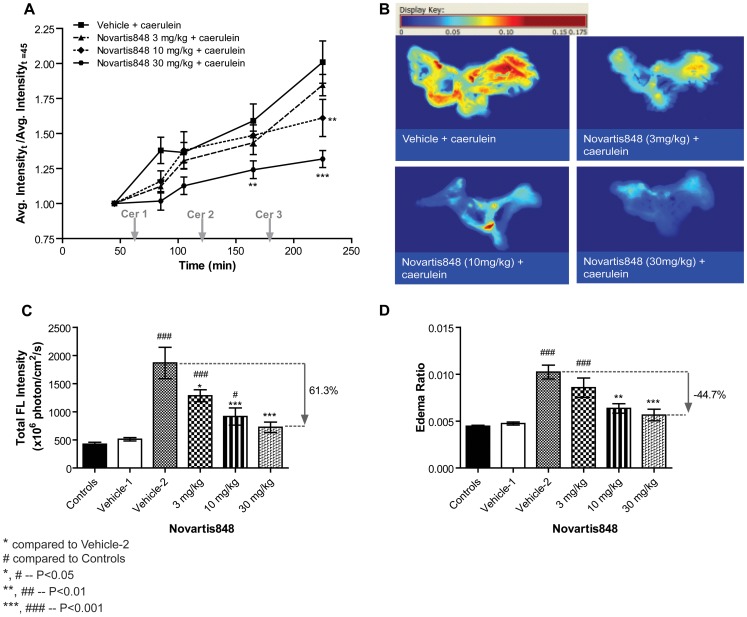
Methods: Edema development and trypsin activation were imaged in a rat caerulein-injection pancreatitis model. A fluorescent "smart" probe, selectively activated by trypsin, was synthesized by labeling with Cy5.5 of a pegylated poly-L-lysine copolymer. Following injection of the probe, trypsin activation was monitored in the presence or absence of inhibitors by in vivo and ex vivo imaging.

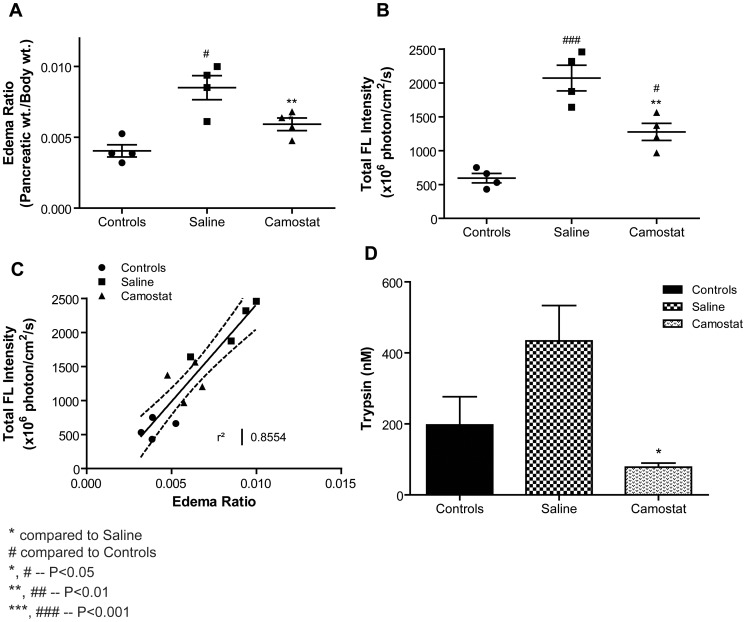
Results: We established the trypsin-selectivity of the fluorescent probe in vitro using a panel of endopeptidases and specific inhibitor. In vivo, the probe accumulated in the liver and a region attributed to the pancreas by necropsy. A dose dependent decrease of total pancreatic fluorescence signal occurred upon administration of known trypsin inhibitors. The fluorescence-based method was a better predictor of trypsin inhibition than pancreatic to body weight ratio.

Conclusions: We established a fluorescence imaging assay to access trypsin inhibition in real-time in vivo. This method is more sensitive and dynamic than classic tissue sample readouts and could be applied to preclinically optimize trypsin inhibitors towards intrapancreatic target inhibition.


Conflict of interest statement

Competing Interests: The authors are, at present, or were during the time of their contribution to this manuscript, employed by Novartis Pharmaceuticals, under the umbrella of the Novartis Institutes for Biomedical Research (NIBR). As such, the authors all own stock in Novartis as part of their remuneration for employment. There are no competing interests as regards consultancies, patents or products in development or currently marketed. This does not alter the authors’ adherence to all the PLOS ONE policies on sharing data and materials.

Figures

Figure 1
Figure 1. MPEG-PL-Cy5.5 probe characterization.
Activation of 0.2 µM of the mPEG-PL-Cy5.5 probe by 100 nM of various pancreatic enzymes in the presence or absence of 1 µM of SPINK1. Probe is specifically activated in the presence of trypsin. Trypsin activity is diminished in the presence of SPINK1. Data represented mean ± SD.
Figure 2
Figure 2. In vivo pancreatitis imaging of edema (A) and trypsin activation (B).
A). Animals (n = 3) were imaged before and after administering the blood pool agent Angiosense 680. Animals were then administered three subsequent doses of caerulein and imaged at various time points. B). Animals (n = 3) were administered the mPEG-PL-Cy5.5 probe 1 h before first caerulein injection. Data represented mean ± SEM.
Figure 3
Figure 3. In vivo study with trypsin and serine protease activity inhibitor Camostat.
A) Animals were administered Camostat at 300 mg/kg orally 24 h and 2 h prior to imaging study. Blood pool fluorescent contrast agent Angiosense was administered intravenously and animals were imaged at different times during a 3 h study with Caerulein induced pancreatitis to assess the development of edema. B) (n = 3) The graph is a quantification of the fluorescent intensity corresponding to the time points in A) and normalized to image obtained prior to caerulein administration. C) Another set of animals was administered the mPEG-PL-Cy5.5 probe to monitor the activity of trypsin in caerulein induced pancreatitis animals. D) (n = 6) The signal in the pancreas was quantified and plotted. Data represented mean ± SEM. E) Untreated saline animal average normalized fluorescent intensity from the Angiosense animals and mPEG-PL-Cy5.5 probe was plotted.
Figure 4
Figure 4. Ex vivo analysis of animals receiving the mPEG-PL-Cy5.5 probe in the Camostat study.
A) The pancreas from each animal was excised and weighed. Camostat treated animals showed significant reduction in the edema ratio compared to untreated saline animals. B) Total signal intensity of the activated mPEG-PL-Cy5.5 probe in the excised pancreas was quantified. Camostat animals showed a significant reduction in signal intensity compared to untreated saline animals. C) The total signal intensity was plotted against the edema ratio. A positive correlation was observed. D) At the end of the study, pancreas samples were also analyzed for the amount of enzymatically active trypsin. Camostat treated animals showed significant reduction in the amount of active trypsin compared to untreated saline animals. Data represented mean ± SEM.
Figure 5
Figure 5. Application of the mPEG-PL-Cy5.5 probe to evaluate the efficacy of trypsin inhibitor Novartis166.
Animals were administered PBS, Vehicle ( = “control”), or varying concentration of Novartis166 IP prior to caerulein induction of pancreatitis. Pancreas were excised and in vivo fluorescent images were acquired at the end of a 3 h caerulein induced pancreatitis study. A) The graph shows the fluorescent intensity of the mPEG-PL-Cy5.5 probe. Novartis166 at 30 mg/kg significantly reduced the activation of the trypsin mPEG-PL-Cy5.5 probe compared to other the Vehicle group. B) The corresponding edema ratio also indicated that Novartis166 at 30 mg/kg significantly abrogated the development of edema compared to the Vehicle group. C) The amount of Novartis166 present in the pancreas was also assessed. The amount of Novartis166 present correlated to the dose administered. D) At 30 mg/kg of Novartis166, in vivo probe activation time course was also evaluated. With increasing time, the activation of the mPEG-PL-Cy5.5 probe was significantly reduced. Data represented mean ± SEM.
Figure 6
Figure 6. Evaluation of trypsin inhibitor Novartis848 on intrapancreatic trypsin activity and edema formation using mPEG-PL-Cy5.5 probe.
Animals were administered PBS, vehicle, or varying concentration of Novartis848 IP 1 h prior to caerulein induction of pancreatitis (n = 5∼7). Vehicle-1 = vehicle for Novartis848+ SC PBS, Vehicle-2 = vehicle for Novartis848+ SC caerulein. A) Animals were administered the mPEG-PL-Cy5.5 probe to monitor the activity of trypsin in caerulein induced pancreatitis animals. Animals receiving 30 mg/kg of Novartis848 and caerulein showed marked reduction in the signal intensity in the areas of the pancreas compared to vehicle animals. B), C) & D) Pancreas were excised, weighed and fluorescent images were acquired at the end of a 3 h caerulein induced pancreatitis study. B) Fluorescence heat maps of excised pancreas. C) Excised pancreas fluorescence showed results similar to the in vivo imaging study. At 30 mg/kg of Novartis848 the fluorescence of the probe was significantly reduced in comparison to Vehicle-2 animals. (D) The edema ratio. Data represented mean ± SEM.

Similar articles

Cited by

References

    1. Rickes S, Uhle C (2009) Advances in the diagnosis of acute pancreatitis. Postgrad Med J 85: 208–212. - PubMed
    1. Kylanpaa-Back ML, Kemppainen E, Puolakkainen P (2002) Trypsin-based laboratory methods and carboxypeptidase activation peptide in acute pancreatitis. JOP 3: 34–48. - PubMed
    1. Spanier BW, Dijkgraaf MG, Bruno MJ (2008) Epidemiology, aetiology and outcome of acute and chronic pancreatitis: An update. Best Pract Res Clin Gastroenterol 22: 45–63. - PubMed
    1. Carroll JK, Herrick B, Gipson T, Lee SP (2007) Acute pancreatitis: diagnosis, prognosis, and treatment. Am Fam Physician 75: 1513–1520. - PubMed
    1. Le Marechal C, Masson E, Chen JM, Morel F, Ruszniewski P, et al. (2006) Hereditary pancreatitis caused by triplication of the trypsinogen locus. Nat Genet 38: 1372–1374. - PubMed

Publication types