

Genetic diversity, linkage disequilibrium and selection signatures in chinese and Western pigs revealed by genome-wide SNP markers
- PMID: 23409110
- PMCID: PMC3567019
- DOI: 10.1371/journal.pone.0056001
Genetic diversity, linkage disequilibrium and selection signatures in chinese and Western pigs revealed by genome-wide SNP markers
Abstract
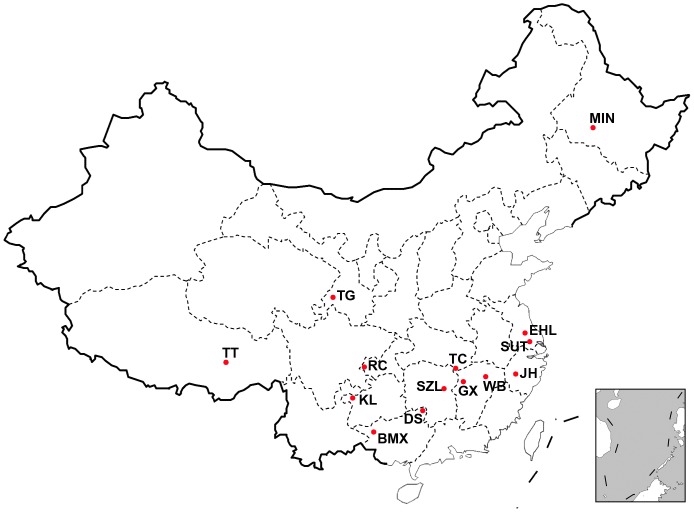
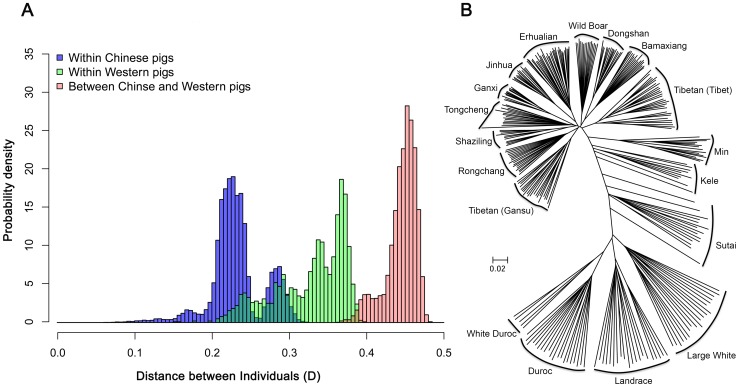
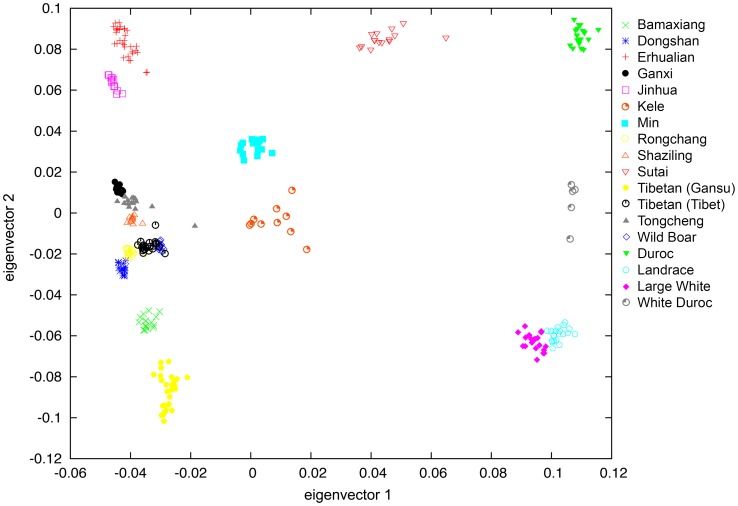
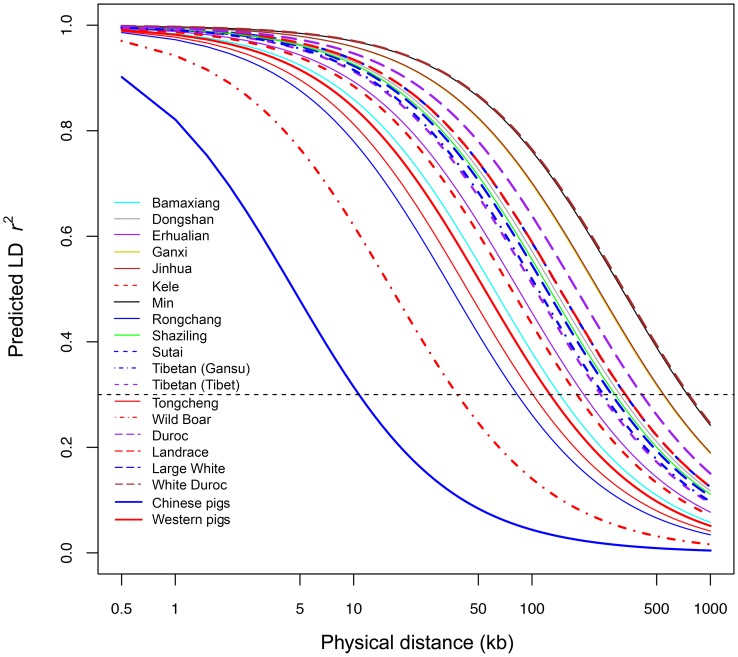
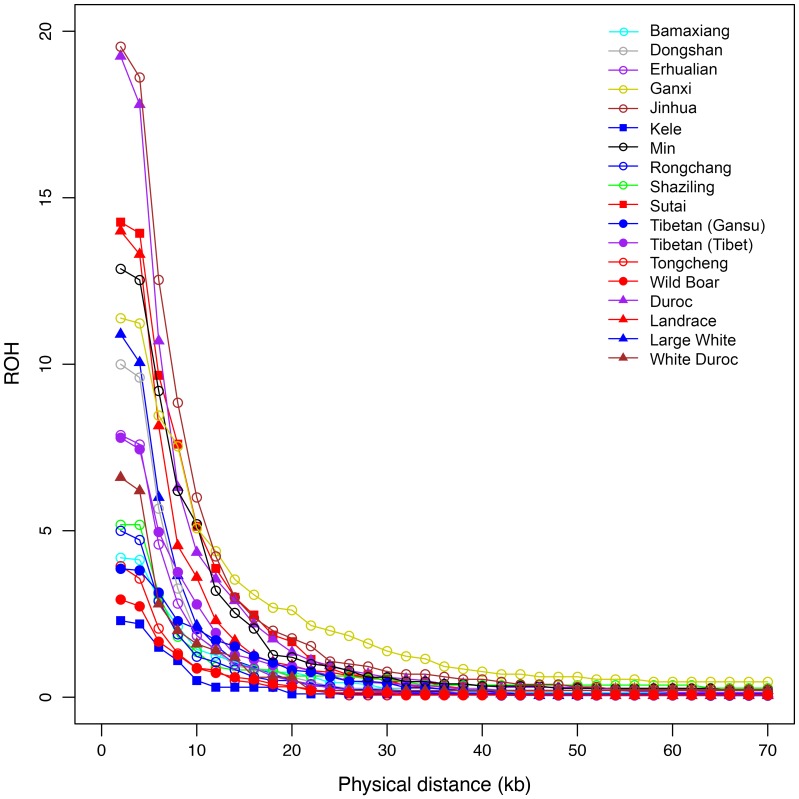
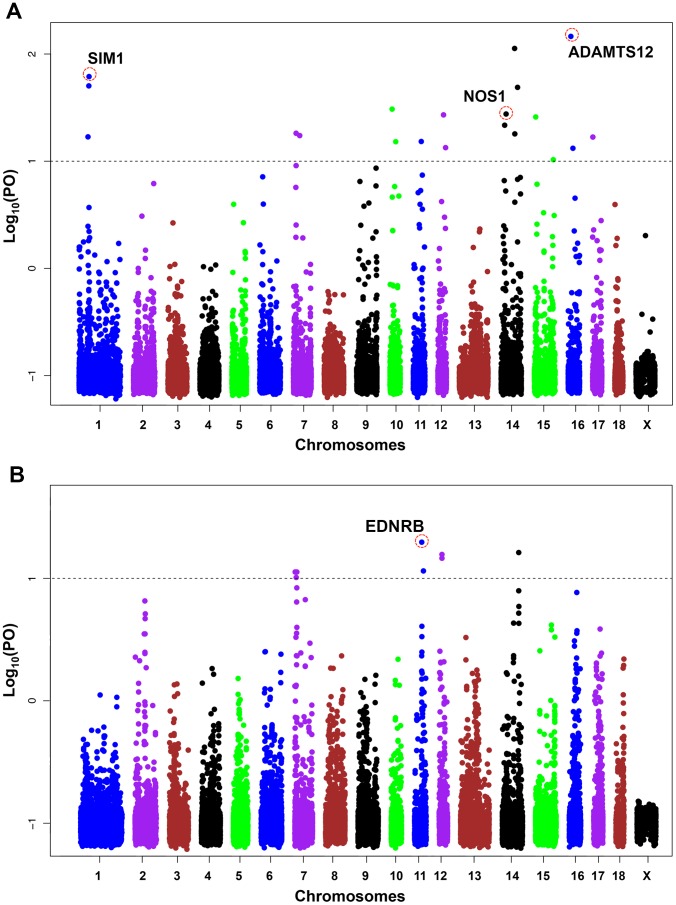
To investigate population structure, linkage disequilibrium (LD) pattern and selection signature at the genome level in Chinese and Western pigs, we genotyped 304 unrelated animals from 18 diverse populations using porcine 60 K SNP chips. We confirmed the divergent evolution between Chinese and Western pigs and showed distinct topological structures of the tested populations. We acquired the evidence for the introgression of Western pigs into two Chinese pig breeds. Analysis of runs of homozygosity revealed that historical inbreeding reduced genetic variability in several Chinese breeds. We found that intrapopulation LD extents are roughly comparable between Chinese and Western pigs. However, interpopulation LD is much longer in Western pigs compared with Chinese pigs with average r(2) (0.3) values of 125 kb for Western pigs and only 10.5 kb for Chinese pigs. The finding indicates that higher-density markers are required to capture LD with causal variants in genome-wide association studies and genomic selection on Chinese pigs. Further, we looked across the genome to identify candidate loci under selection using F(ST) outlier tests on two contrast samples: Tibetan pigs versus lowland pigs and belted pigs against non-belted pigs. Interestingly, we highlighted several genes including ADAMTS12, SIM1 and NOS1 that show signatures of natural selection in Tibetan pigs and are likely important for genetic adaptation to high altitude. Comparison of our findings with previous reports indicates that the underlying genetic basis for high-altitude adaptation in Tibetan pigs, Tibetan peoples and yaks is likely distinct from one another. Moreover, we identified the strongest signal of directional selection at the EDNRB loci in Chinese belted pigs, supporting EDNRB as a promising candidate gene for the white belt coat color in Chinese pigs. Altogether, our findings advance the understanding of the genome biology of Chinese and Western pigs.
Conflict of interest statement
Figures
References
-
- Gieling ET, Schuurman T, Nordquist RE, van der Staay FJ (2011) The pig as a model animal for studying cognition and neurobehavioral disorders. Curr Top Behav Neurosci 7: 359–383. - PubMed
-
- Kijas JM, Andersson L (2001) A phylogenetic study of the origin of the domestic pig estimated from the near-complete mtDNA genome. J Mol Evol 52: 302–308. - PubMed
-
- Larson G, Dobney K, Albarella U, Fang M, Matisoo-Smith E, et al. (2005) Worldwide phylogeography of wild boar reveals multiple centers of pig domestication. Science 307: 1618–1621. - PubMed
-
- McLaren DG (1990) The potential of Chinese swine breeds to improve pork production efficiency in the US. Anim Breed Abstr 58: 347–368.
Publication types
MeSH terms
LinkOut - more resources
Full Text Sources
Other Literature Sources
Research Materials
Miscellaneous
