. 2013;8(2):e56062.
doi: 10.1371/journal.pone.0056062. Epub 2013 Feb 7.

Deletion of fibroblast growth factor receptor 2 from the peri-wolffian duct stroma leads to ureteric induction abnormalities and vesicoureteral reflux

Affiliations

Deletion of fibroblast growth factor receptor 2 from the peri-wolffian duct stroma leads to ureteric induction abnormalities and vesicoureteral reflux

Kenneth A Walker et al. PLoS One. 2013.

Erratum in

Abstract

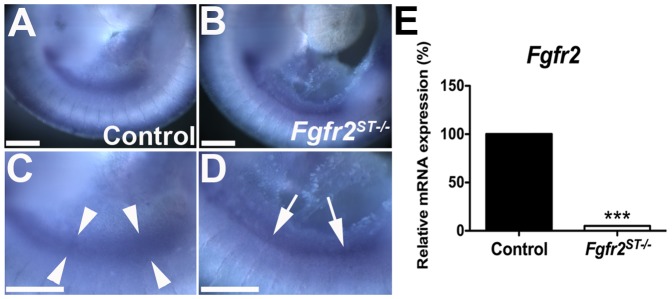
Purpose: Pax3cre-mediated deletion of fibroblast growth factor receptor 2 (Fgfr2) broadly in renal and urinary tract mesenchyme led to ureteric bud (UB) induction defects and vesicoureteral reflux (VUR), although the mechanisms were unclear. Here, we investigated whether Fgfr2 acts specifically in peri-Wolffian duct stroma (ST) to regulate UB induction and development of VUR and the mechanisms of Fgfr2 activity.

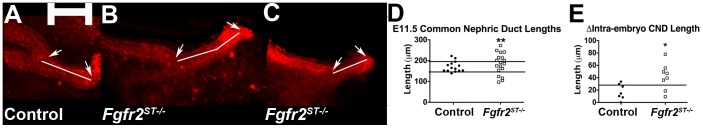
Methods: We conditionally deleted Fgfr2 in ST (Fgfr2(ST-/-)) using Tbx18cre mice. To look for ureteric bud induction defects in young embryos, we assessed length and apoptosis of common nephric ducts (CNDs). We performed 3D reconstructions and histological analyses of urinary tracts of embryos and postnatal mice and cystograms in postnatal mice to test for VUR. We performed in situ hybridization and real-time PCR in young embryos to determine mechanisms underlying UB induction defects.

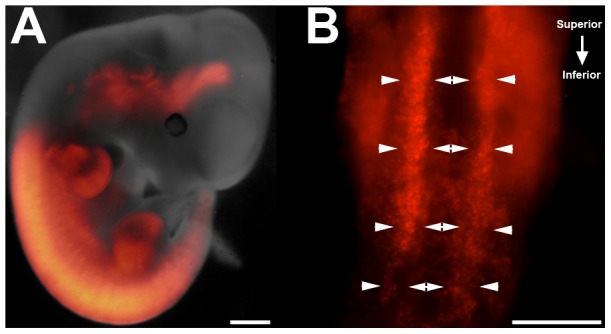
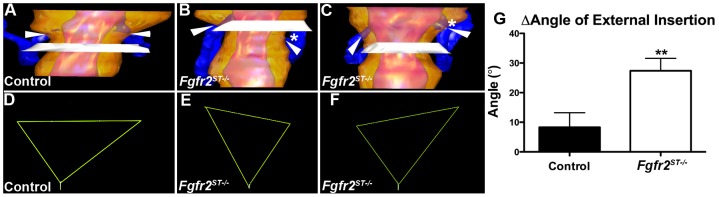
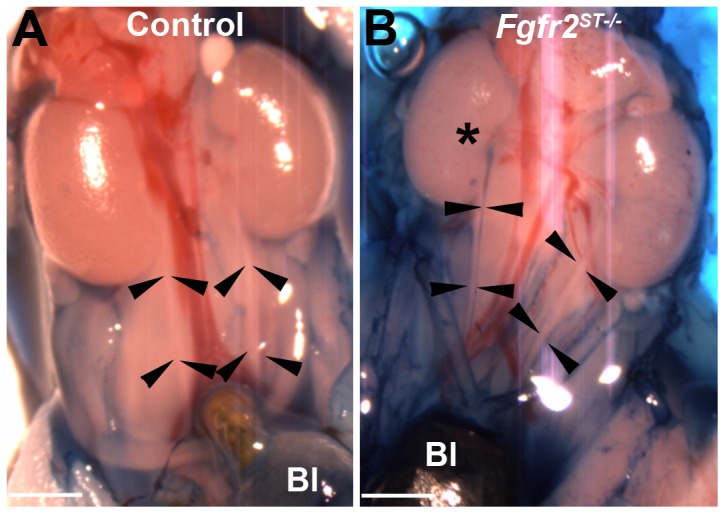
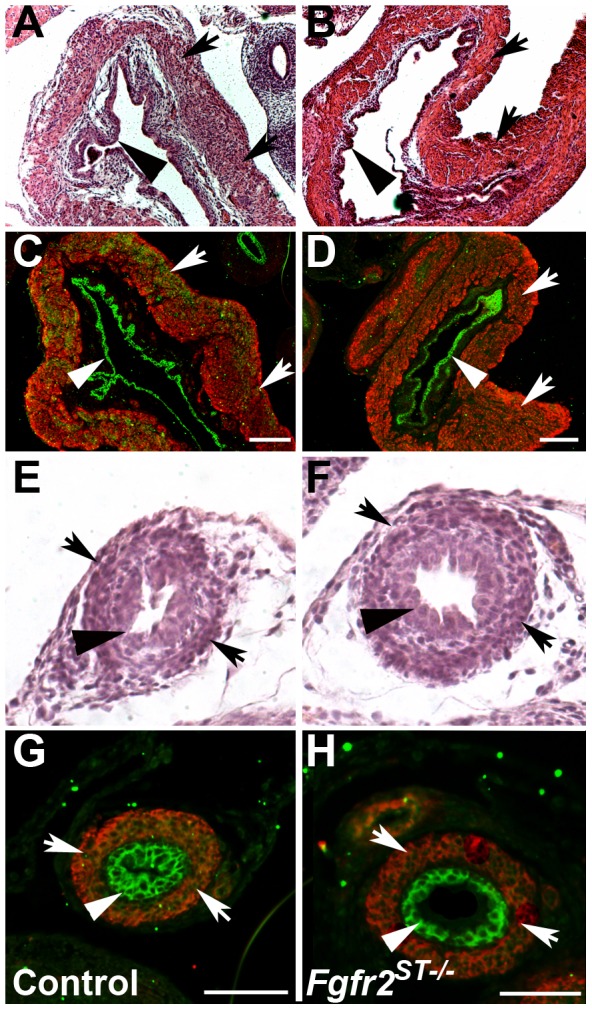
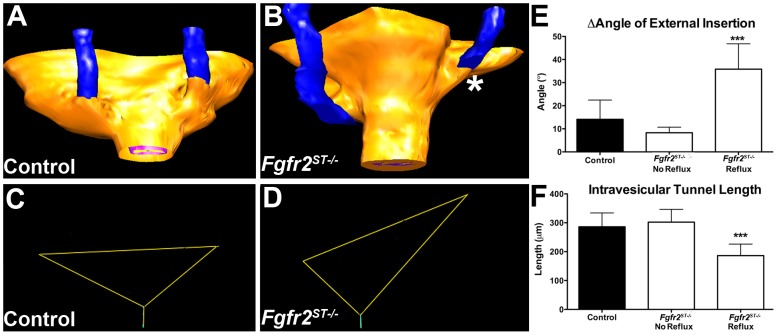
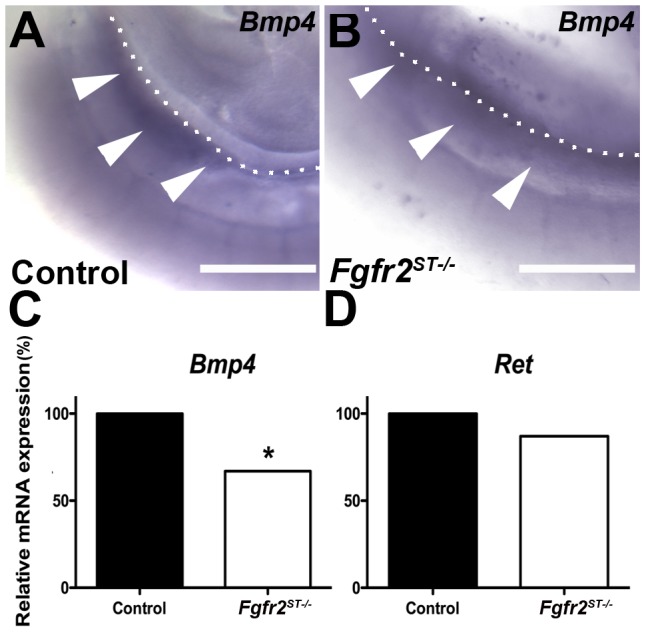
Results: We confirmed that Fgfr2 is expressed in ST and that Fgfr2 was efficiently deleted in this tissue in Fgfr2(ST-/-) mice at embryonic day (E) 10.5. E11.5 Fgfr2(ST-/-) mice had randomized UB induction sites with approximately 1/3 arising too high and 1/3 too low from the Wolffian duct; however, apoptosis was unaltered in E12.5 mutant CNDs. While ureters were histologically normal, E15.5 Fgfr2(ST-/-) mice exhibit improper ureteral insertion sites into the bladder, consistent with the ureteric induction defects. While ureter and bladder histology appeared normal, postnatal day (P) 1 mutants had high rates of VUR versus controls (75% versus 3%, p = 0.001) and occasionally other defects including renal hypoplasia and duplex systems. P1 mutant mice also had improper ureteral bladder insertion sites and shortened intravesicular tunnel lengths that correlated with VUR. E10.5 Fgfr2(ST-/-) mice had decreases in Bmp4 mRNA in stromal tissues, suggesting a mechanism underlying the ureteric induction and VUR phenotypes.

Conclusion: Mutations in FGFR2 could possibly cause VUR in humans.


Conflict of interest statement

Competing Interests: The authors have declared that no competing interests exist.

Figures

Figure 1
Figure 1. Expression of the Tbx18cre in E10.5 mouse embryos and urogenital tracts.
A. E10.5 Cag-Tbx18creTg/+ mice demonstrate cre expression noted by RFP staining (red) in numerous tissues including fore- and hindlimbs, spine and urogenital ridges. B. Ventral view of dissected urogenital ridges illustrates robust cre expression in the peri-Wolffian duct stroma at E10.5 (highlighted between arrowheads). Scale bars = 100 µm. ***p<0.001 vs. control embryos.
Figure 2
Figure 2. Expression of Fgfr2 in E10.5 in control and Fgfr2ST−/− embryos.
A,C. Lower power (A) and higher power (C) images show that control embryos have a wide band of Fgfr2 signal (between arrowheads) encompassing the Wolffian duct and surrounding stroma. B,D. Lower power (B) and higher power (D) images show that Fgfr2ST−/− embryos have a linear band of Fgfr2 expression in the Wolffian duct epithelium (arrows) and not in the surrounding stroma. E. Quantitative real-time PCR of FAC-sorted E10.5 Cag-Tbx18creTg/+ (Control) and Cag-Fgfr2ST−/− (Fgfr2St−/−) urogenital ridges confirms a dramatic decrease in Fgfr2 mRNA expression in mutant Tbx18cre expressing cells. Scale bars = 100 µm. ***p<0.001 vs. control embryos.
Figure 3
Figure 3. Common nephric duct (CND) lengths in E11.5 control and Fgfr2ST−/− embryos.
A–C. Whole mount cytokeratin immunostaining reveals that compared with control common nephric duct lengths (A, line), mutants often have duct lengths that are longer (B, line) or shorter (C, line). Arrows indicate the boundaries of the CND. Scale bar = 100 µm. D. Graph demonstrating that the majority of duct lengths in controls are within 1SD of the mean (between the lines), whereas the majority of the Fgfr2ST−/− lengths are less than or greater than 1SD of the control mean. E. Graph demonstrating that the majority of control CND lengths within the same embryo are within one control SD (line), whereas the majority of Fgfr2ST−/− duct lengths within the same embryo differ by greater than one control SD. *p<0.05, **p<0.01 vs. control embryos.
Figure 4
Figure 4. Three-dimensional reconstructions of ureteral insertion sites into the bladders of E15.5 control and Fgfr2ST−/− embryos.
A Ureter (blue) insertion sites (arrowheads) in control embryos occur just above the level of the pubic symphysis (white plane) in a symmetric pattern. B–C. Fgfr2ST−/− embryos have asymmetric ureteral insertion into the developing bladder, one with a low left insertion (B, *) and one with a high left insertion (C, *). D–F. External trigone of the control (from A) shows a normal inverted isosceles triangle (D), whereas the mutants (from B & C) have distorted external trigones with marked differences in angles at the insertion sites (E, F). G. Graph demonstrating the differences in external trigonal angles are much greater in mutants than controls **p<0.01; (n) = 3 per genotype; Values are mean+SD. yellow = bladder surface; pink = bladder lumen.
Figure 5
Figure 5. Representative cystograms in P1 Fgfr2ST−/− and control mice.
A. Control ureters have no dye (between arrowheads) indicating no VUR. B. Fgfr2ST−/− mouse has dye in the right ureter up to the renal pelvis (*) indicating grade II VUR. Bl indicates the bladder. Scale bar = 500 µm.
Figure 6
Figure 6. Bladder and ureter morphology in P1 Fgfr2ST−/− and control mice following cystograms.
A–B. H&E staining shows similar bladder histology between controls (A) and mutants (B). C–D. Immunofluorescence (IF) also shows normal urothelium (green) and alpha smooth muscle actin staining (red) in control (C) and Fgfr2ST−/− mice (D). E–H. H&E staining and IF shows normal urothelium and muscle layers in control ureters (E, G) and mutant ureters (F, H). Arrows indicate muscle layer; Arrowheads indicate urothelium. Scale bar = A–D: 300 µm, E–H: 500 µm.
Figure 7
Figure 7. Three-dimensional reconstructions of ureteral insertion sites into the bladders of P1 control and Fgfr2ST−/− embryos.
A–B. Control mouse without VUR (A) has ureters (blue) that insert into bladders (yellow) at the same level, whereas the Fgfr2St−/− mouse with left sided VUR (B) has a high and laterally displaced ureteral insertion site on that side (*). C–D. External trigone drawn from the control (from A) shows similar right and left sided external angles whereas the mutant (from B) has a marked differences in the left and right external angles. E. Graph demonstrating that the differences in external trigonal angles are much greater in mutants with VUR than controls or mutants without VUR. Values in E–F are mean+SD; ***p<0.001 vs. control and vs. Fgfr2St−/− mutants without VUR).
Figure 8
Figure 8. Expression of Bmp4 and Ret mRNA at E10.5 in control and Fgfr2ST−/− urogenital ridges.
A–B. In situ hybridization for Bmp4 shows apparent reduced expression in the peri-Wolffian duct stroma in mutants (B, white arrowheads) versus controls (A, white arrowheads). C–D. Graphs of real time PCR confirm that Fgfr2ST−/− urogenital ridges have an ∼40% reduction in Bmp4 mRNA (C), whereas Ret mRNA levels are equivalent (D). Values are means normalized to control expression levels; *p<0.05, **p<0.01 vs. control; n = 3 urogenital ridges per genotype per analysis. Dotted lines indicate the dorsal aspect of the Wolffian duct in each image. Scale bar = 100 µm.

Comment in

  • Findings of Research Misconduct.
    [No authors listed] [No authors listed] NIH Guide Grants Contracts (Bethesda). 2016 May 20:NOT-OD-16-090. NIH Guide Grants Contracts (Bethesda). 2016. PMID: 27220120 Free PMC article. No abstract available.
  • Findings of Research Misconduct.
    [No authors listed] [No authors listed] Fed Regist. 2016 May 11;81(91):29278. Fed Regist. 2016. PMID: 27737276 Free PMC article. No abstract available.

References

    1. Costantini F, Kopan R (2010) Patterning a complex organ: branching morphogenesis and nephron segmentation in kidney development. Dev Cell 18: 698–712. - PMC - PubMed
    1. Michos O, Goncalves A, Lopez-Rios J, Tiecke E, Naillat F, et al. (2007) Reduction of BMP4 activity by gremlin 1 enables ureteric bud outgrowth and GDNF/WNT11 feedback signalling during kidney branching morphogenesis. Development 134: 2397–2405. - PubMed
    1. Mackie GG, Awang H, Stephens FD (1975) The ureteric orifice: the embryologic key to radiologic status of duplex kidneys. J Pediatr Surg 10: 473–481. - PubMed
    1. Mackie GG, Stephens FD (1975) Duplex kidneys: a correlation of renal dysplasia with position of the ureteral orifice. J Urol 114: 274–280. - PubMed
    1. Murawski IJ, Gupta IR (2006) Vesicoureteric reflux and renal malformations: a developmental problem. Clin Genet 69: 105–117. - PubMed

Publication types

MeSH terms

Substances

LinkOut - more resources