. 2013;8(2):e56117.
doi: 10.1371/journal.pone.0056117. Epub 2013 Feb 7.

Hepatocyte growth factor activator inhibitor-1 is induced by bone morphogenetic proteins and regulates proliferation and cell fate of neural progenitor cells

Affiliations

Hepatocyte growth factor activator inhibitor-1 is induced by bone morphogenetic proteins and regulates proliferation and cell fate of neural progenitor cells

Raili Koivuniemi et al. PLoS One. 2013.

Abstract

Background: Neural progenitor cells (NPCs) in the developing neuroepithelium are regulated by intrinsic and extrinsic factors. There is evidence that NPCs form a self-supporting niche for cell maintenance and proliferation. However, molecular interactions and cell-cell contacts and the microenvironment within the neuroepithelium are largely unknown. We hypothesized that cellular proteases especially those associated with the cell surface of NPCs play a role in regulation of progenitor cells in the brain.

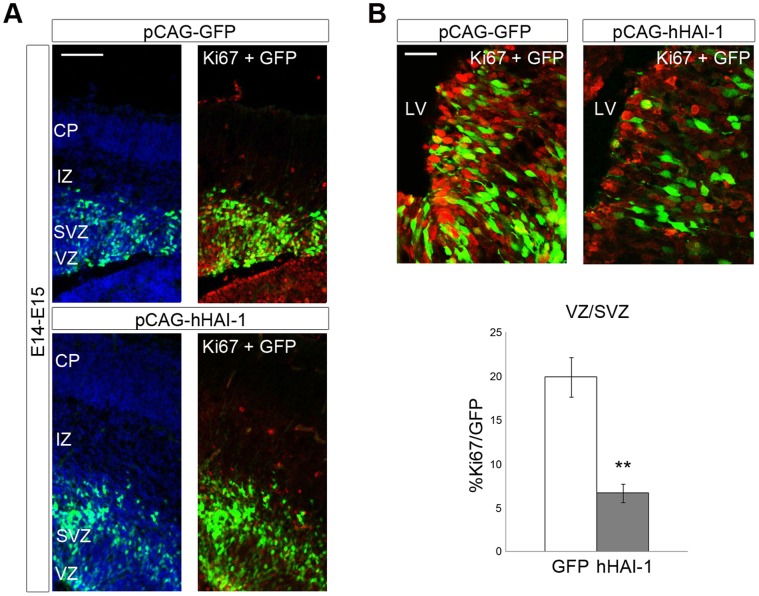
Methodology/principal findings: In this work, we show that NPCs, isolated from striatal anlage of developing rat brain, express hepatocyte growth factor activator inhibitor-1 and -2 (HAI-1 and HAI-2) that are cell surface-linked serine protease inhibitors. In addition, radial glia cells derived from mouse embryonic stem cells also express HAI-1 and HAI-2. To study the functional significance of HAI-1 and HAI-2 in progenitor cells, we modulated their levels using expression plasmids or silencing RNA (siRNA) transfected into the NPCs. Data showed that overexpression of HAI-1 or HAI-2 decreased cell proliferation of cultured NPCs, whilst their siRNAs had opposite effects. HAI-1 also influenced NPC differentiation by increasing the number of glial fibrillary acidic protein (GFAP) expressing cells in the culture. Expression of HAI-1 in vivo decreased cell proliferation in developing neuroepithelium in E15 old animals and promoted astrocyte cell differentiation in neonatal animals. Studying the regulation of HAI-1, we observed that Bone morphogenetic protein-2 (BMP-2) and BMP-4 increased HAI-1 levels in the NPCs. Experiments using HAI-1-siRNA showed that these BMPs act on the NPCs partly in a HAI-1-dependent manner.

Conclusions: This study shows that the cell-surface serine protease inhibitors, HAI-1 and HAI-2 influence proliferation and cell fate of NPCs and their expression levels are linked to BMP signaling. Modulation of the levels and actions of HAI-1 in NPCs may be of a potential value in stem cell therapies in various brain diseases.


Conflict of interest statement

Competing Interests: The authors have declared that no competing interests exist.

Figures

Figure 1
Figure 1. HAI-1 and HAI-2 are expressed in neural progenitor cells and in the developing neuroepithelium.
Sections were made from dorsal area of developing embryonic day 17 (E17)-old and postnatal P1-day old rat brain cortex. Immunostaining was done using specific antibodies as described in Methods. Neural progenitor cells were prepared from the striatal anlage of E17 old rats and cultivated as described in Methods. Nestin is a marker for progenitor cells and Ki67 for dividing cells. (A–B) Immunofluorescence of dorsal cortex of E17 old (A) or P1 old rats (B). Left panels, HAI-1 and HAI-2 positive cells (red fluorescence). Right panels, Ki67- and Nestin-positive cells (green fluorescence). LV, lateral ventricle. Scale bar, 200 µm. (C–D) Higher magnification of confocal images showing double-staining of HAI-1 and HAI-2 (red fluorescence) with Nestin positive cells (green fluorescence) in E17 (C) and P1 (D) brain. Scale bars, 50 µm. (E–F) Immunocytochemistry of NPCs isolated from developing striatum of E17 rat brain. HAI-1 and HAI-2 are shown in red and Ki67 (E) and Nestin (F) in green fluorescence. Merged pictures to the right show double-stained cells (yellow fluorescence). Note double staining of almost all Nestin-positive cells. Lower panels in (E) show control staining without secondary antibodies, and nuclei are stained using Hoechst blue. Scale bars, 20 µm. (G) Immunoblots of the NPCs cultivated under proliferating (P) or differentiating (D) conditions (see Methods). HAI-1 (55 kDa band) remains fairly constant, whereas HAI-2 (34 kDa) decreases during cell differentiation. ß-actin was used as a loading control.
Figure 2
Figure 2. Effects of HAI-1 and HAI-2 overexpression and downregulation on cell proliferation in NPCs.
NPCs were isolated from developing E17-old striatum and were transfected as described in Methods using overexrepressing constructs or silencing RNA (siRNA) as indicated. (A) Left, Schematic view of human full-length and transmembrane-lacking (dTM) constructs of HAI-1 and HAI-2. 8 µg of expression plasmids for these constructs were transfected into NPCs as described in Methods. Control cells were transfected with EGFP plasmids. Right, Immunoblots of transfected cells detected using anti-HAI-1 and anti-HAI-2 antibodies detecting human HAI-1 at 66 kDa, and human HAI-2 at 34 kDa and 28 kDa, respectively. N, aminoterminus; KD, Kunitz domain; LDLR, LDL receptor-like domain; TM, transmembrane domain; C, carboxyterminus. (B) The number of Ki67-positive of all cells was determined by immunocytochemistry. Expression of HAI-1 and HAI-2 for 6 days reduced the number of dividing cells compared with controls (mock). Values are means ± SEM, n = 3. **p<0.01 for HAI-1 constructs vs. control, and *p<0.05 for HAI-2 constructs vs. control. (C) Immunoblot of the cell cycle regulator, CyclinD1. ß-actin was used as a control. Quantification below shows a decrease in CyclinD1 after HAI-1 and HAI-2 expression. Values are means ± SEM, n = 4. ***p<0.001 for HAI-1 vs. control, and **p<0.01 for HAI-2 vs. control. (D) Downregulation of HAI-1 by siRNA increased the number of dividing cells. Control cells received scrambled siRNA. After 3 days with siRNA the number of BrdU-positive cells was determined by immunostaining. Values are means ± SEM, n = 4. *p<0.05 for HAI-1 siRNA vs. control. HAI-1 levels are shown to the right. (E) Cell culture supernatant from hybridoma cells producing monoclonal anti-HAI-1 antibodies (MG2, see Hallikas et al., 2006) was diluted 1∶50 and added to the cultures for 3 days. Note an increase in the number of dividing NPCs. Values are means ± SEM, n = 3. *p<0.05 for MG2 vs. control. (F) Downregulation of HAI-2 by siRNA increased the number of BrdU-positive dividing cells after 3 days. Control cells received scrambled siRNA. Values are means ± SEM, n = 3. *p<0.05 for HAI-2 siRNA vs. control. HAI-2 mRNA levels are shown to the right. (G) Immunoblot of Erk1/2. The phosphorylation of Erk1/2 was reduced by HAI-1 overexpression. Total Erk1/2 was not changed. ß-actin was used as a control. Quantification below. Values are means ± SEM, n = 3. *p<0.05 for HAI-1 vs. control.
Figure 3
Figure 3. Bone morphogenetic proteins (BMPs) regulate HAI-1 and HAI-2 expression.
NPCs were isolated from developing striatum of E17 old rats and treated with 100 ng/ml BMP-2 or BMP-4 and analyzed further as indicated. (A–C) HAI-1 changes. Expression of HAI-1 was analyzed using RT-PCR (A) and qPCR (B) after 24 h stimulation and by immunoblotting (C) after 3 days stimulation. Values are means ± SEM, n = 4. *p<0.05 for BMPs vs. control. (D–F) HAI-2 changes. Expression of HAI-2 was analyzed using RT-PCR (D, F) after 3 days of stimulation and by qPCR (E) after 24 h stimulation. Values are means ± SEM, n = 4. **p<0.01 and *p<0.05 for BMPs vs. control.
Figure 4
Figure 4. BMP-4 influences NPC division through HAI-1.
NPCs were isolated from developing striatum of E17 old rats and treated as indicated below. (A) Immunostaining. Stimulation with 25 ng/ml BMP-4 increases the number of phospho-Smad positive NPCs and this was inhibited by adding 25 ng/ml Noggin. Values are means ± SEM, n = 3. **p<0.01 for BMP-4 vs. control and for BMP-4+Noggin vs. BMP-4. (B) siRNAs were added for 48 h to downregulate HAI-1 and HAI-2. Cells were further treated with 25 ng/ml BMP-4 for another 24 h, and the number of BrdU-positive cells determined. Values are means ± SEM, n = 3. **p<0.01 for BMP-4 vs. control and *p<0.05 for HAI-1/HAI-2 siRNA +BMP-4 vs. BMP-4 treatment.
Figure 5
Figure 5. Effects of BMPs and HAI-1 and HAI-2 on cell differentiation.
(A) NPCs were isolated from developing striatum of E17 old rats and stimulated with 25 ng/ml BMP-4 for 4 days followed by incubation without EGF to induce cell differentiation (see Methods). The relative numbers of neurons (ß-tubulin), astrocytes (GFAP) and oligodendroglial (CNPase) cells were identified using specific antibodies. Note an increase in number of GFAP-positive cells by BMP-4. Values are means ± SEM, n = 4. *p<0.05 for BMP-4 vs. C. (B) NPCs were transfected with 5 µg of HAI-1 or HAI-2 expression plasmids and cell differentiation was induced for 5 days. The number of specific cell types was determined by immunostaining. Note an increase in number of GFAP-positive cells by HAI-1. Values are means ± SEM, n = 4. *p<0.05 for HAI-1 vs. control. (C) NPCs were transfected with HAI-1 siRNA and stimulated with BMP-2 for 24 h and cell differentiation was induced for 5 days. BMP-2 increased the number of GFAP-positive cells and this effect was inhibited by the downregulation of HAI-1. Values are means ± SEM, n = 3. **p<0.01 for BMP-2+HAI-1 siRNA vs. BMP-2 alone.
Figure 6
Figure 6. Expression of BMPs and BMP type-I receptors in developing neuroepithelium and in cultured progenitor cells.
NPCs were isolated from developing striatum of E17 old rats and Radial glial (RG) cells were derived from mouse embryonic stem (ES) cells as described in Methods. (A) In situ hybridization was done using E17 old rat dorsal cortex and digoxigenin-labeled probes as described in Methods. Note expression of BMPR-IA and BMPR-IB receptors. BMP-2 was strongly expressed in the neuroepithelium of dorsal cortex. Scale bar, 500 µm. (B) RT-PCR was done as described in Methods. BMP-4, BMPR-IA, BMPR-IB as well as Noggin are expressed by cultured rat NPCs isolated from the striatal anlage, and by RG cells derived from mouse ES cells. For BMP-2 only NPCs were studied.
Figure 7
Figure 7. Expression of HAI-1 in developing E14-old rat neuroepithelium reduces cell proliferation.
E14 old mice embryos were electroporated as described in Methods using 1 µg pCAG-GFP control plasmid alone or a combination of 0.75 µg pCAG-human HAI-1and 0.25 µg pCAG-GFP. E15-old Brains from E15-old mice were processed as described in Methods. (A) E15 brain sections were immunostained with anti-Ki67 antibodies (red). The number of double stained cells in the ventricular and subventricular zones was counted and expressed as a percentage of total GFP-positive cells (green). Upper panel, injection of GFP control plasmid. Lower panel, HAI-1 plasmid. Scale bar, 100 µm. CP, cortical plate; IZ, intermediate zone; SVZ, subventricular zone; VZ, ventricular zone. (B) Higher magnification. Scale bar, 50 µm. Left panel, control. Right panel. HAI-1 plasmid. Quantification below. Values are means ± SEM, n = 6. **p<0.01 for HAI-1 vs. GFP. LV, lateral ventricle.
Figure 8
Figure 8. Expression of HAI-1 in developing E17-old rat brain promotes glial cell fate.
E17 old mice embryos were electroporated as described above and the brains processed at postnatal day 1 (P1). (A) P1-old sections were immunostained with anti-GFAP antibodies (red). The number of double stained cells in the marginal zone was counted and expressed as a percentage of total GFP-positive cells (green). The merged pictures show coexpression of GFAP and GFP. Upper panel, injection of GFP control plasmid. Lower panel, HAI-1 expression plasmids. Scale bar, 100 µm. MZ, marginal zone; CP, cortical plate; IZ, intermediate zone; SVZ, subventricular zone; VZ, ventricular zone. (B) Higher magnification. Scale bar, 25 µm. Quantification to the right. Values are means ± SEM. n = 3. *p<0.05 for HAI-1 vs. GFP. (C) Higher magnification shows colozalization of HAI-1 and GFP stained cells in the MZ. Scale bar, 25 µm.

Similar articles

Cited by

References

    1. Szabo R, Bugge TH (2011) Membrane-anchored serine proteases in vertebrate cell and developmental biology. Annu Rev Cell Dev Biol 27: 213–235. - PMC - PubMed
    1. Tung HH, Lee SL (2012) Neural transmembrane protease and endothelial Gs protein activation in cell contact-dependent signaling between neural stem/progenitor cells and brain endothelial cells. J Biol Chem 287: 22497–22508. - PMC - PubMed
    1. Temple S (2001) The development of neural stem cells. Nature 414: 112–117. - PubMed
    1. Kataoka H, Suganuma T, Shimomura T, Itoh H, Kitamura N, et al. (1999) Distribution of hepatocyte growth factor activator inhibitor type 1 (HAI-1) in human tissues. Cellular surface localization of HAI-1 in simple columnar epithelium and its modulated expression in injured and regenerative tissues. J Histochem Cytochem 47: 673–682. - PubMed
    1. Oberst M, Anders J, Xie B, Singh B, Ossandon M, et al. (2001) Matriptase and HAI-1 are expressed by normal and malignant epithelial cells in vitro and in vivo. Am J Pathol 158: 1301–1311. - PMC - PubMed

Publication types

MeSH terms

Substances