. 2013;8(2):e56157.
doi: 10.1371/journal.pone.0056157. Epub 2013 Feb 7.

Anticipating the prevalence of avian influenza subtypes H9 and H5 in live-bird markets

Affiliations

Anticipating the prevalence of avian influenza subtypes H9 and H5 in live-bird markets

Kim M Pepin et al. PLoS One. 2013.

Abstract

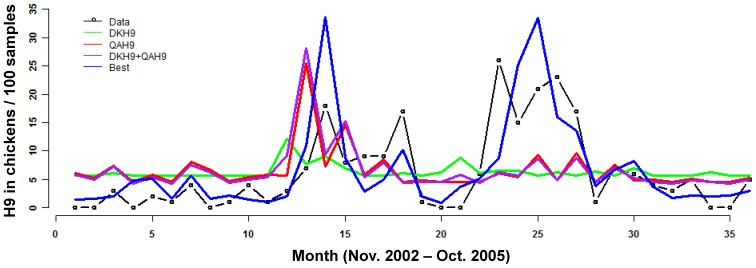
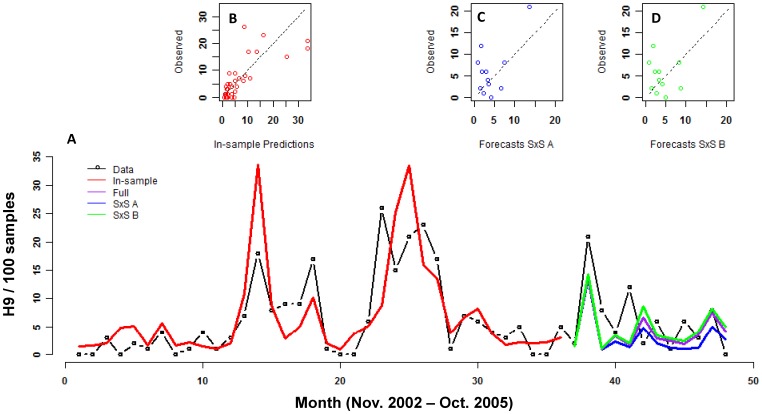
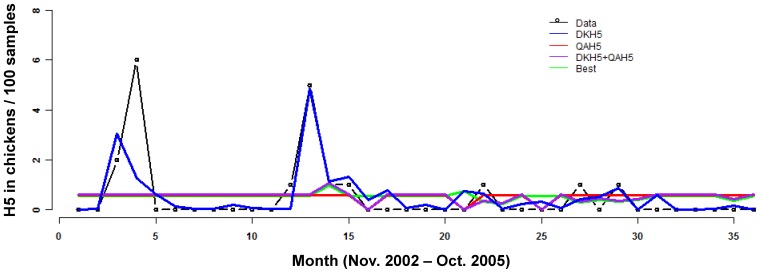
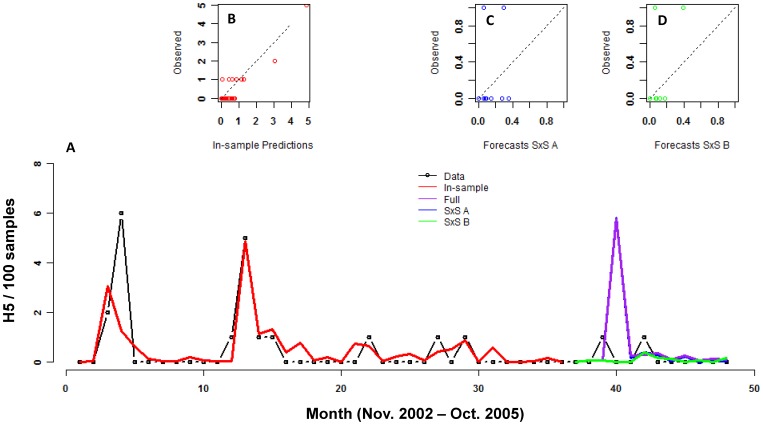
An ability to forecast the prevalence of specific subtypes of avian influenza viruses (AIV) in live-bird markets would facilitate greatly the implementation of preventative measures designed to minimize poultry losses and human exposure. The minimum requirement for developing predictive quantitative tools is surveillance data of AIV prevalence sampled frequently over several years. Recently, a 4-year time series of monthly sampling of hemagglutinin subtypes 1-13 in ducks, chickens and quail in live-bird markets in southern China has become available. We used these data to investigate whether a simple statistical model, based solely on historical data (variables such as the number of positive samples in host X of subtype Y time t months ago), could accurately predict prevalence of H5 and H9 subtypes in chickens. We also examined the role of ducks and quail in predicting prevalence in chickens within the market setting because between-species transmission is thought to occur within markets but has not been measured. Our best statistical models performed remarkably well at predicting future prevalence (pseudo-R(2) = 0.57 for H9 and 0.49 for H5), especially considering the multi-host, multi-subtype nature of AIVs. We did not find prevalence of H5/H9 in ducks or quail to be predictors of prevalence in chickens within the Chinese markets. Our results suggest surveillance protocols that could enable more accurate and timely predictive statistical models. We also discuss which data should be collected to allow the development of mechanistic models.


Conflict of interest statement

Competing Interests: The authors have declared that no competing interests exist.

Figures

Figure 1
Figure 1. Model fits for H9.
Data at the prevalence of H9 per 100 chickens sampled. Data were modeled by negative binomial regression with a log link. “Best” is the set of covariates that were selected by AIC: allH4, allH6, QAH6, QAH9, allH5t-1, where “all” is the prevalence of subtype HX in all 3 host species (CK+DK+QA), “QA” is for prevalence in only quail, “DK” is for prevalence in only duck, and t-1 is the prevalence in the previous month.
Figure 2
Figure 2. Forecasts with the best model for H9.
The model was fit (red) on the first 3 years of data (black). Forecasts are shown for the fourth year of data using 3 methods: 1) Forecasting the full 12 months of data (blue), 2) Iterative fitting and forecasting where additional data were included at each step (SxS A, purple), and 3) Iterative fitting and forecasting using a sliding window where model parameters were always estimated from 36 months of data (SxS B, green). B-D show an alternative way of viewing the fits. B shows the fit of the model and C and D show the fit of the forecasted points using the two best methods (SxS A (C) and SxS B (D)).
Figure 3
Figure 3. Model fits for H5.
Data are the prevalence of H5 per 100 chickens sampled. Data were modeled by zero-inflated negative binomial regression with a log link on the abundance component. “Best” is the set of covariates that were selected by AIC: maximum wind speed and DKH9t-1, where “DK” is for prevalence in ducks, and t-1 is the prevalence in the previous month.
Figure 4
Figure 4. Forecasts with the best model for H5.
The model was fit (red) on the first 3 years of data (black). Forecasts are shown for the fourth year of data using 3 methods: 1) Forecasting the full 12 months of data (blue), 2) Iterative fitting and forecasting where additional data were included at each step (SxS A, purple), and 3) Iterative fitting and forecasting using a sliding window where model parameters were always estimated from 36 months of data (SxS B, green). B-D show an alternative way of viewing the fits. B shows the fit of the model and C and D show the fit of the forecasted points using the two best methods (SxS A (C) and SxS B (D)).

Similar articles

Cited by

References

    1. Peiris M (2009) Avian influenza viruses in humans. Revue Scientifique et Technique 28: 161–173. - PubMed
    1. Wong SS, Yuen KY (2006) Avian influenza virus infections in humans. Chest 129: 156–168. - PMC - PubMed
    1. Negovetich NJ, Feeroz MM, Jones-Engel L, Walker D, Alam SM, et al. (2011) Live bird markets of Bangladesh: H9N2 viruses and the near absence of highly pathogenic H5N1 influenza. Plos One 6: e19311. - PMC - PubMed
    1. Pepin KM, Wang J, Webb CT, Smith GJD, Poss M, et al. (2013) Multiannual patterns of influenza A transmission in Chinese live-bird market systems. Influenza and Other respiratory Viruses 7: 97–107. - PMC - PubMed
    1. Jadhao SJ, Nguyen DC, Uyeki TM, Shaw M, Maines T, et al. (2009) Genetic analysis of avian influenza A viruses isolated from domestic waterfowl in live-bird markets of Hanoi, Vietnam, preceding fatal H5N1 human infections in 2004. Archives of Virology 154: 1249–1261. - PubMed

Publication types