. 2013;8(2):e56350.
doi: 10.1371/journal.pone.0056350. Epub 2013 Feb 11.

Non-image-forming light driven functions are preserved in a mouse model of autosomal dominant optic atrophy

Affiliations

Non-image-forming light driven functions are preserved in a mouse model of autosomal dominant optic atrophy

Georgia Perganta et al. PLoS One. 2013.

Abstract

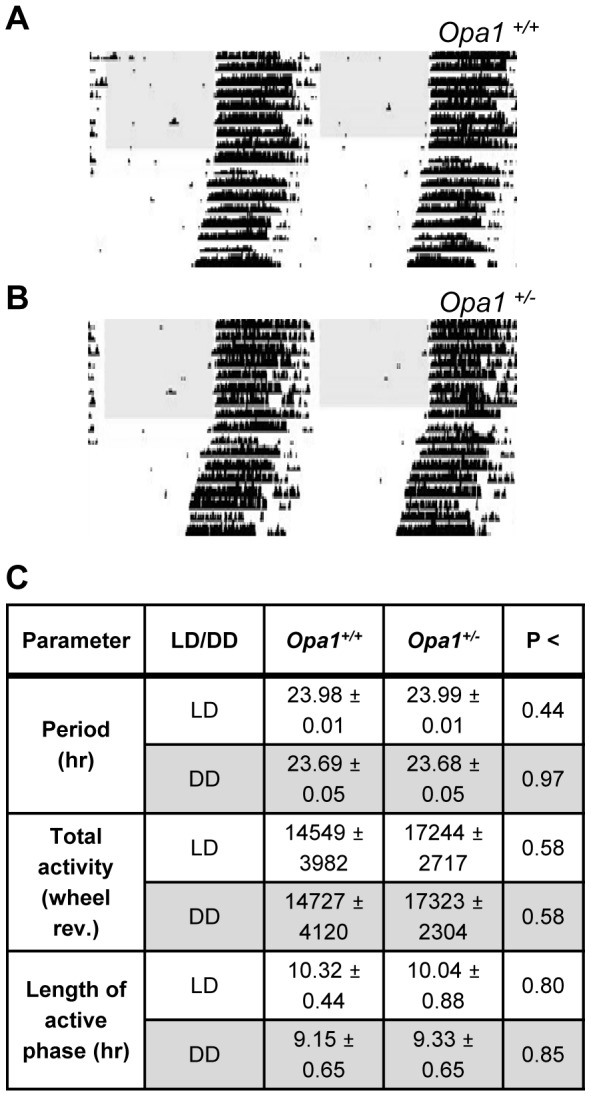
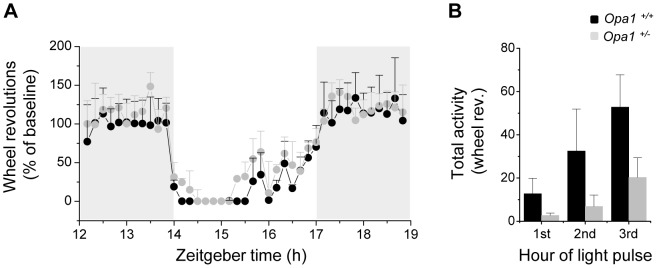
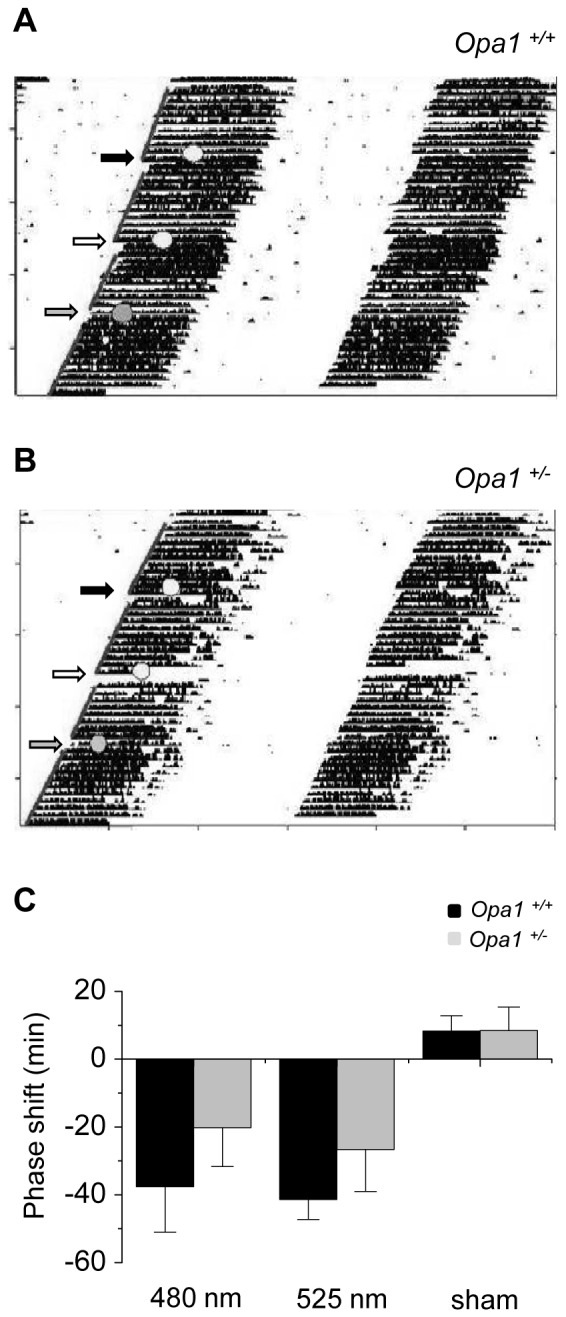
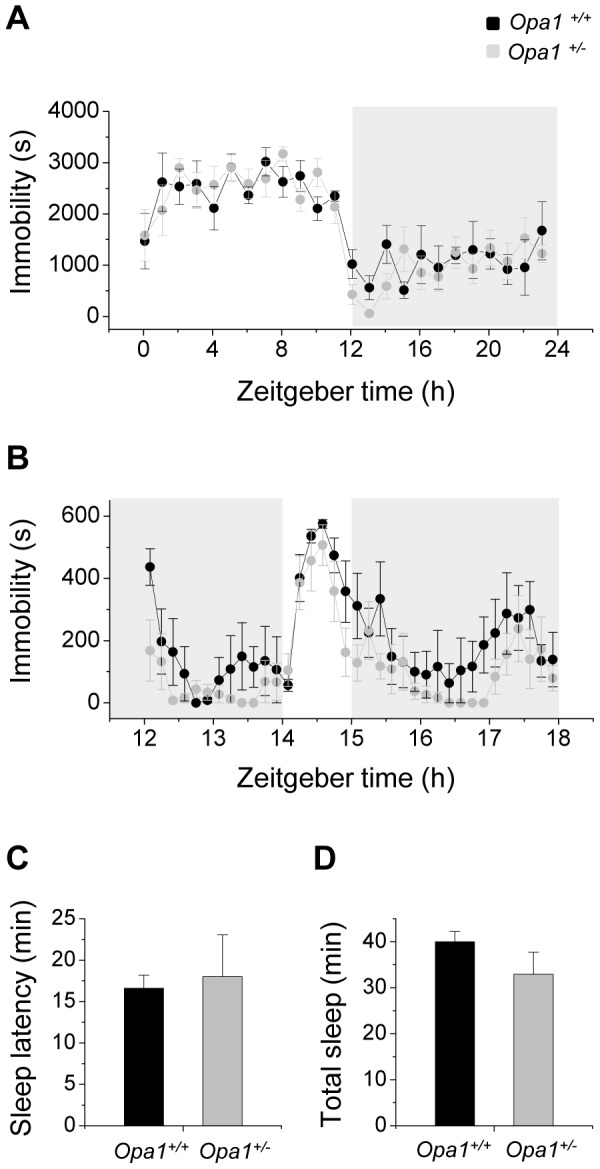
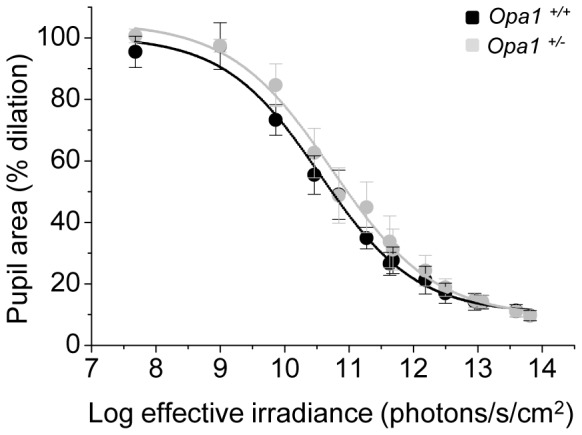
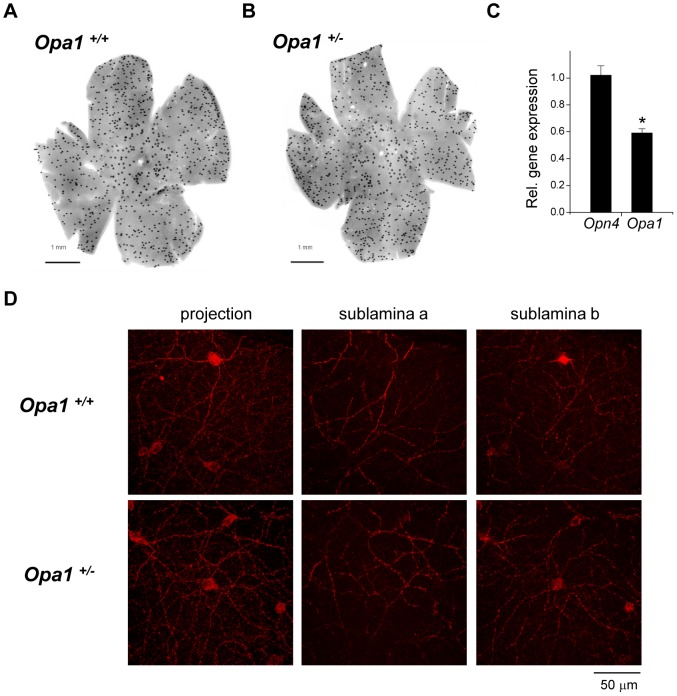
Autosomal dominant optic atrophy (ADOA) is a slowly progressive optic neuropathy that has been associated with mutations of the OPA1 gene. In patients, the disease primarily affects the retinal ganglion cells (RGCs) and causes optic nerve atrophy and visual loss. A subset of RGCs are intrinsically photosensitive, express the photopigment melanopsin and drive non-image-forming (NIF) visual functions including light driven circadian and sleep behaviours and the pupil light reflex. Given the RGC pathology in ADOA, disruption of NIF functions might be predicted. Interestingly in ADOA patients the pupil light reflex was preserved, although NIF behavioural outputs were not examined. The B6; C3-Opa1(Q285STOP) mouse model of ADOA displays optic nerve abnormalities, RGC dendropathy and functional visual disruption. We performed a comprehensive assessment of light driven NIF functions in this mouse model using wheel running activity monitoring, videotracking and pupillometry. Opa1 mutant mice entrained their activity rhythm to the external light/dark cycle, suppressed their activity in response to acute light exposure at night, generated circadian phase shift responses to 480 nm and 525 nm pulses, demonstrated immobility-defined sleep induction following exposure to a brief light pulse at night and exhibited an intensity dependent pupil light reflex. There were no significant differences in any parameter tested relative to wildtype littermate controls. Furthermore, there was no significant difference in the number of melanopsin-expressing RGCs, cell morphology or melanopsin transcript levels between genotypes. Taken together, these findings suggest the preservation of NIF functions in Opa1 mutants. The results provide support to growing evidence that the melanopsin-expressing RGCs are protected in mitochondrial optic neuropathies.


Conflict of interest statement

Competing Interests: The authors have declared that no competing interests exist.

Figures

Figure 1
Figure 1. Circadian behaviour in Opa1+/+ and Opa1+/− mice.
Representative actograms from (A) Opa1 +/+ and (B) Opa1 +/− mice entrained to a 12/12 LD cycle and subsequently released into constant darkness (DD). Each horizontal line corresponds to one day and the data has been double plotted. The black vertical bars represent activity (i.e. wheel revolutions). The shaded region represents lights ON. (C) Table showing average period (τ), total activity levels and length of the active phase in LD and in DD for Opa1+/+ (n = 6) and Opa1+/− (n = 7) mice. There were no significant differences between genotypes (unpaired students t-test; p values are shown). All data are presented as mean ± SEM.
Figure 2
Figure 2. Masking response in Opa1+/+ and Opa1+/− mice.
(A) The average wheel running revolutions on the night (gray background) of the 3 h light pulse (white background) are plotted relative to the baseline levels (the night before the pulse) for Opa1+/+ (n = 6) and Opa1+/− (n = 7) mice. The masking pulse completely suppressed activity in both genotypes immediately. ANOVA analysis found no significant effect of genotype on the baseline corrected activity levels (p = 0.468) (B) Hourly breakdown of activity during the masking pulse. A 2-way ANOVA using activity in each hour of light pulse and genotype as factors found a significant effect of hour of light pulse (p<0.005) but no significant effect of genotype (p = 0.143) and no interaction between genotype and light pulse hour (p = 0.359). All data are presented as mean ± SEM.
Figure 3
Figure 3. Phase shift behaviour in Opa1+/+ and Opa1+/− mice.
Representative actograms from (A) Opa1 +/+ and (B) Opa1 +/ mice in constant dark (DD) conditions. Animals were exposed to 15 min light pulses every ∼15 days. Photon matched pulses at 480 nm (black arrow) or 525 nm (white arrow; 1×10¹¹ photons/s/cm2) were applied at CT16. Animals were also exposed to a dark sham pulse condition (grey arrow). (C) The size of the phase shift response are plotted for the 525 nm, 480 nm and sham conditions for Opa1+/+ (n = 6) and Opa1+/− (n = 7) mice. A two-way ANOVA with genotype and wavelength as factors was performed. There was no significant effect of wavelength (p = 0.66) or genotype (p = 0.17) and the interaction of genotype and wavelength was not significant (p = 0.91).
Figure 4
Figure 4. Induction of sleep by acute light in Opa1+/+ and Opa1+/− mice.
(A) The average immobility-defined sleep is plotted against zeitgeber time in a normal 12∶12 h LD cycle (1 h resolution) for Opa1+/+ (n = 5) and Opa1+/− (n = 6) mice. Animals were largely immobile in the day phase of the LD cycle. White background indicates the day portion and grey background the night portion of the 24 h LD cycle. (B) The effect of the administration of the 1-h light pulse (white background) at ZT 14 during the night phase is shown. Both genotypes demonstrated an increase in immobility during the light pulse (10 min resolution). Quantification of (C) sleep latency and (D) total sleep during light exposure found no significant differences between genotypes (unpaired student's t-test). All data are presented as mean ± SEM.
Figure 5
Figure 5. Pupil light reflex in Opa1+/+ and Opa1+/− mice.
The average minimum pupil area expressed as a percentage of maximum dilation following illumination with various intensities of white light for Opa1+/+ (n = 5) and Opa1+/− (n = 5) mice. All data are fitted with four term sigmoidal functions (solid lines) of the form y = y0+a/(1+exp(-(x-x0)/b)) (goodness of fit of fitted curve to actual data (R2): Opa1+/+ = 0.993 and Opa1+/− = 0.995). A 2-way ANOVA using intensity and genotype as factors showed a significant effect of light intensity (p<0.0001) but no significant effect of genotype (p = 0.51) and no significant interaction between genotype and intensity (p = 0.99).
Figure 6
Figure 6. Melanopsin expression in Opa1+/+ and Opa1+/− retinae.
Overall distribution of melanopsin-positive RGCs in a flatmount retina from (A) Opa1 +/+ and (B) Opa1 +/ mice. The total number of melanopsin expressing cells was not significantly different between genotypes (Opa1+/+: n = 3; Opa1+/: n = 3). (C) Quantification of melanopsin (Opn4) and Opa1 gene expression by real time quantitative PCR. Expression levels in Opa1+/− animals are plotted relative to wildtype data. No significant difference in expression was detected for Opn4 between genotypes. A significant reduction in Opa1 expression was observed in Opa1+/− mice relative to wildtype controls (student's t-test. * = p<0.005). (D) Representative confocal images of melanopsin cells in Opa1+/+ and Opa1+/− retinae. A projected image of a confocal stack (from the inner plexiform layer to the ganglion cell layer) is shown for each genotype. An image at the plane of the outermost region of sublamina a and an image at the plane of the innermost region of sublamina b from the same image stacks is also shown.

References

    1. Kjer P (1959) Infantile optic atrophy with dominant mode of inheritance: a clinical and genetic study of 19 Danish families. Acta Ophthalmol Suppl 164: 1–147. - PubMed
    1. Kline LB, Glaser JS (1979) Dominant optic atrophy. The clinical profile. Arch Ophthalmol 97: 1680–1686. - PubMed
    1. Votruba M, Fitzke FW, Holder GE, Carter A, Bhattacharya SS, et al. (1998) Clinical features in affected individuals from 21 pedigrees with dominant optic atrophy. Arch Ophthalmol 116: 351–358. - PubMed
    1. Johnston PB, Gaster RN, Smith VC, Tripathi RC (1979) A clinicopathologic study of autosomal dominant optic atrophy. Am J Ophthalmol 88: 868–875. - PubMed
    1. Kjer P, Jensen OA, Klinken L (1983) Histopathology of eye, optic nerve and brain in a case of dominant optic atrophy. Acta Ophthalmol (Copenh) 61: 300–312. - PubMed

Publication types

MeSH terms

LinkOut - more resources