

Potential air toxics hot spots in truck terminals and cabs
- PMID: 23409510
- PMCID: PMC5116924
Potential air toxics hot spots in truck terminals and cabs
Abstract
Introduction: Hot spots are areas where concentrations of one or more air toxics--organic vapors or particulate matter (PM)--are expected to be elevated. The U.S. Environmental Protection Agency's (EPA*) screening values for air toxics were used in our definition of hot spots. According to the EPA, a screening value "is used to indicate a concentration of a chemical in the air to which a person could be continually exposed for a lifetime ... and which would be unlikely to result in a deleterious effect (either cancer or noncancer health effects)" (U.S. EPA 2006). Our characterization of volatile organic compounds (VOCs; namely 18 hydrocarbons, methyl tert-butyl ether [MTBE], acetone, and aldehydes) was added onto our ongoing National Cancer Institute-funded study of lung cancer and particulate pollutant concentrations (PM with an aerodynamic diameter < or = 2.5 microm [PM2.5], elemental carbon [EC], and organic carbon [OC]) and source apportionment of the U.S. trucking industry. We focused on three possible hot spots within the trucking terminals: upwind background areas affected by nearby industrial parks; downwind areas affected by upwind and terminal sources; and the loading docks and mechanic shops within terminal as well as the interior of cabs of trucks being driven on city, suburban, and rural streets and on highways.
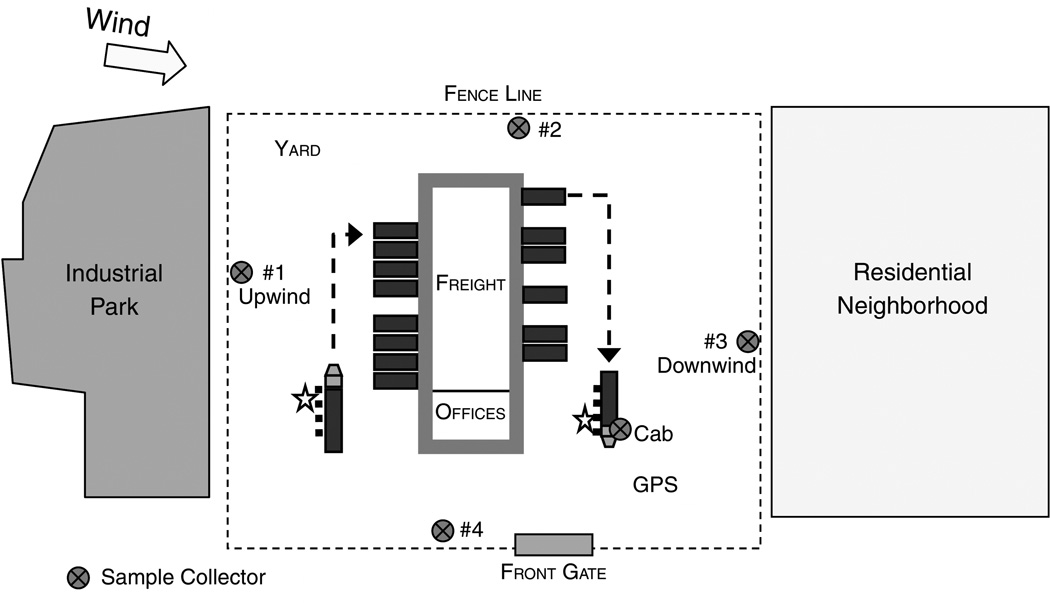
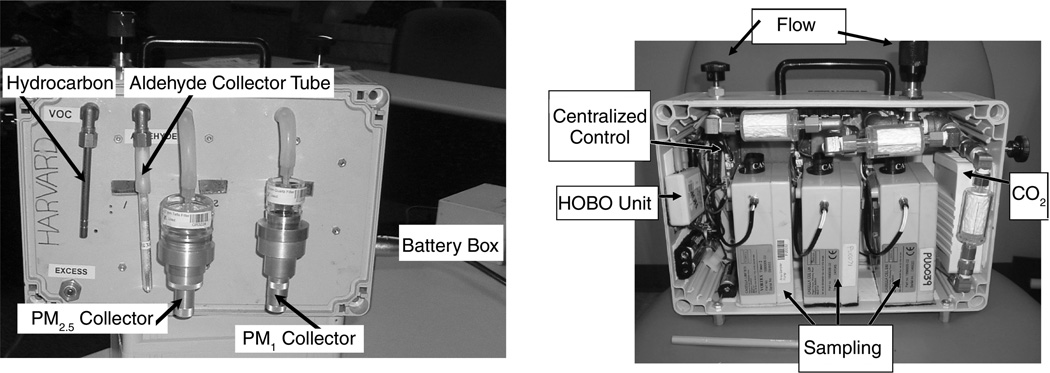
Methods: In Phase 1 of our study, 15 truck terminals across the United States were each visited for five consecutive days. During these site visits, sorbent tubes were used to collect 12-hour integrated samples of hydrocarbons and aldehydes from upwind and downwind fence-line locations as well as inside truck cabs. Meteorologic data and extensive site information were collected with each sample. In Phase 2, repeat visits to six terminals were conducted to test the stability of concentrations across time and judge the representativeness of our previous measurements. During the repeat site visits, the sampling procedure was expanded to include real-time sampling for total hydrocarbon (HC) and PM2.5 at the terminal upwind and downwind sites and inside the truck cabs, two additional monitors in the yard for four-quadrant sampling to better characterize the influence of wind, and indoor sampling in the loading dock and mechanic shop work areas.
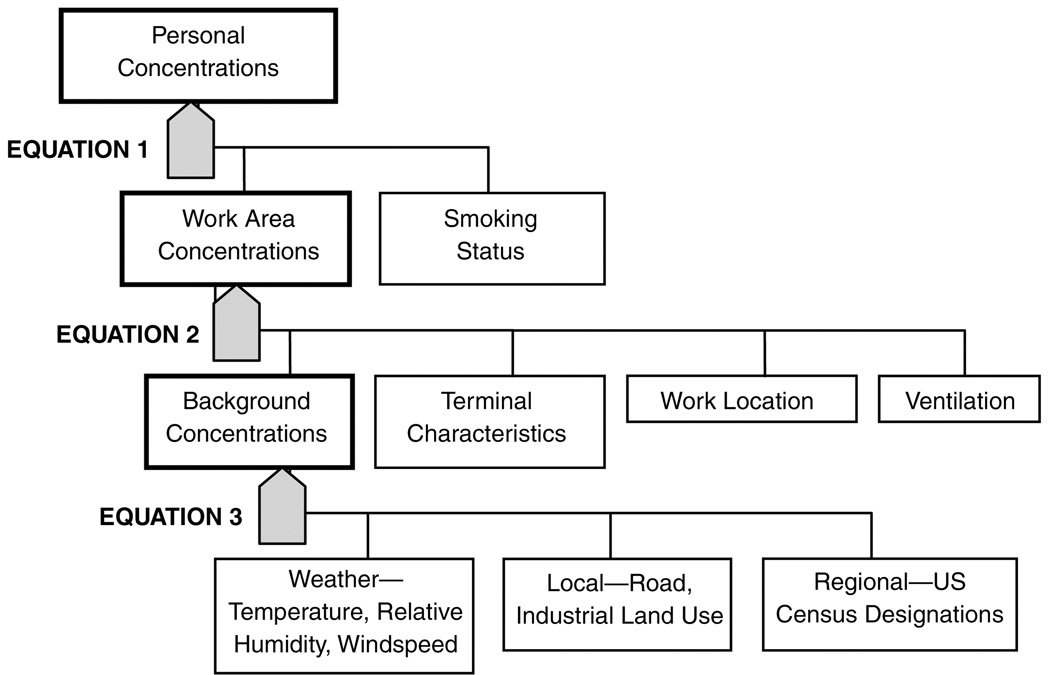
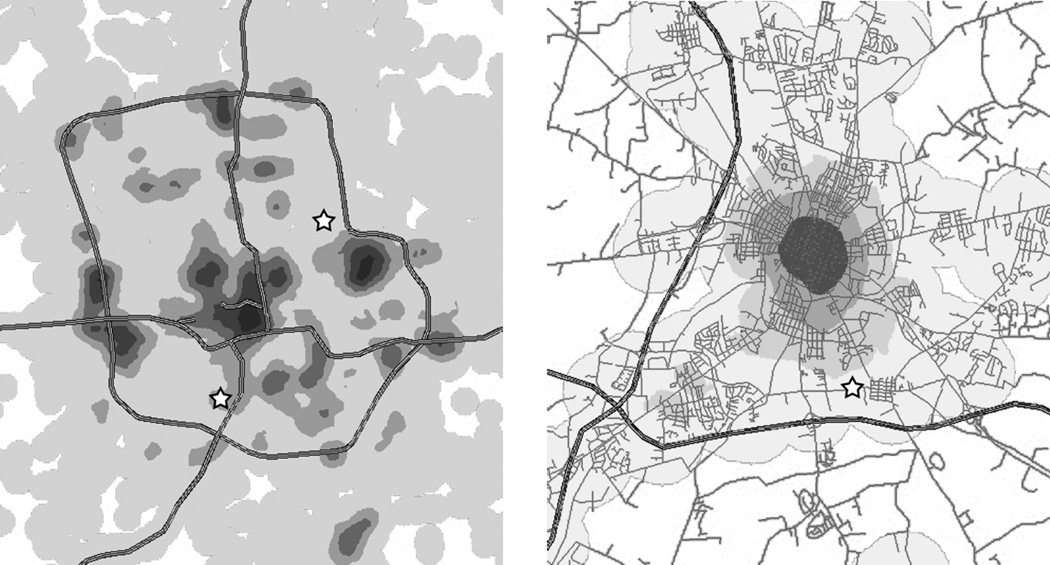
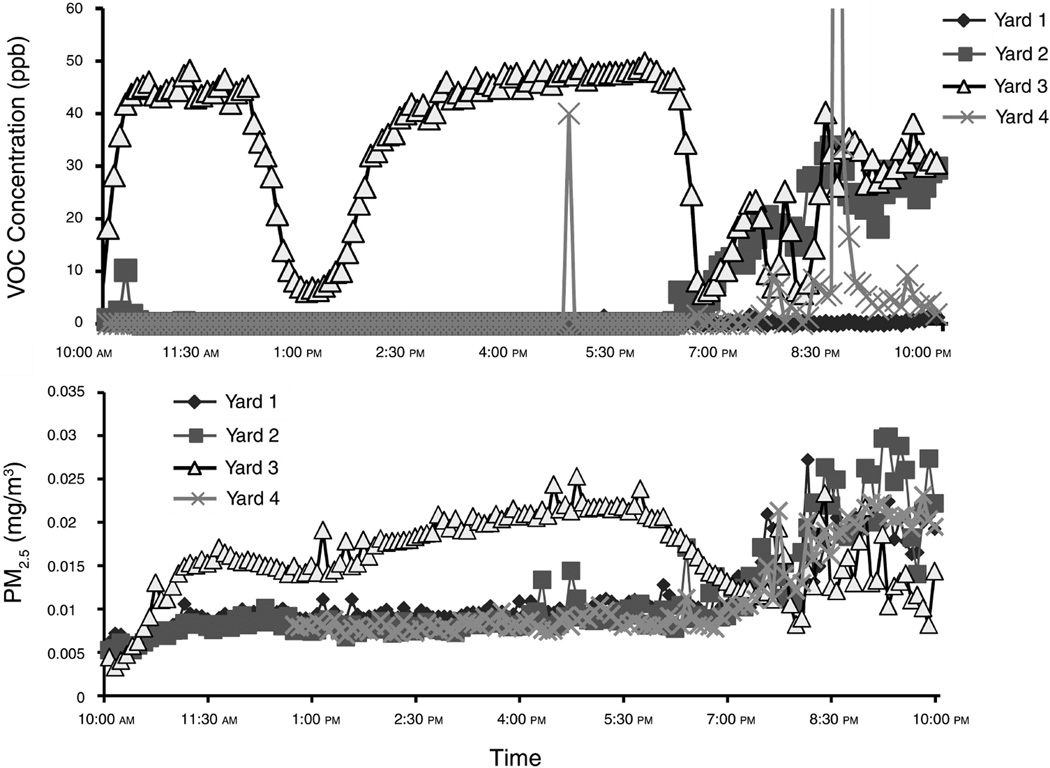
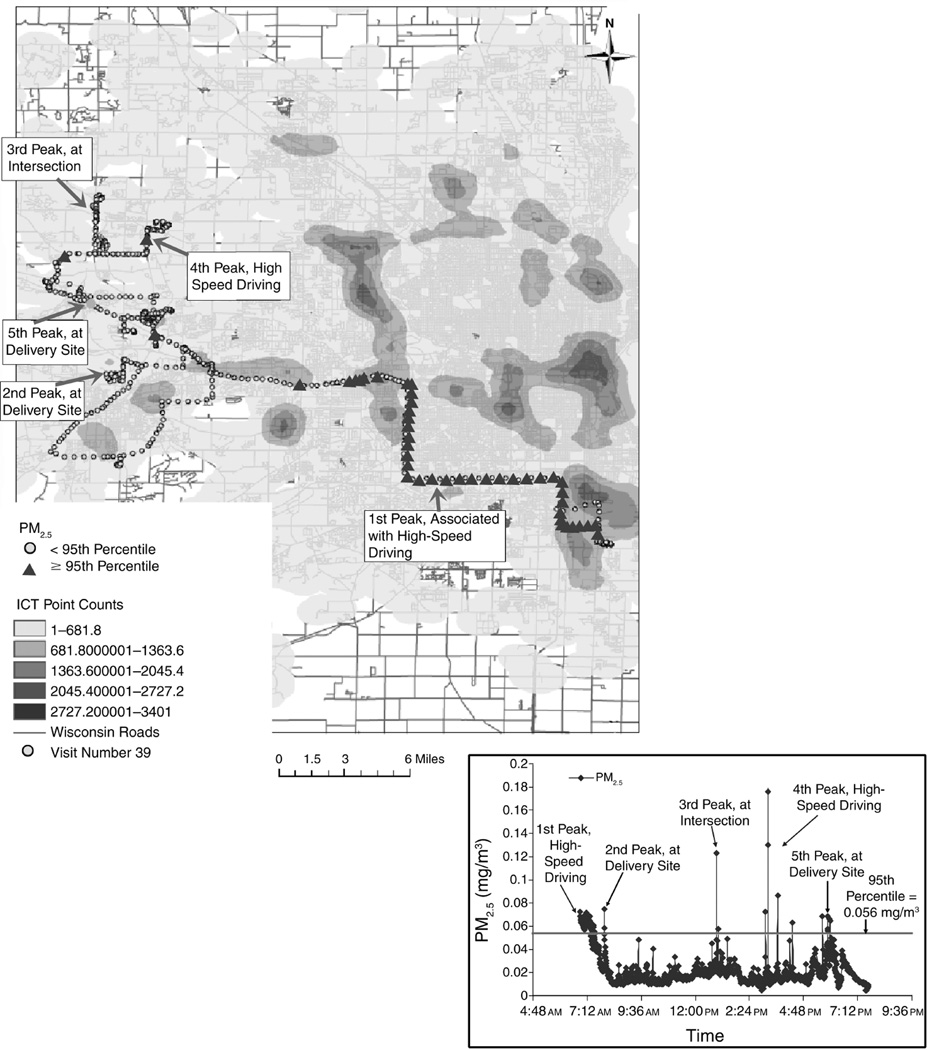
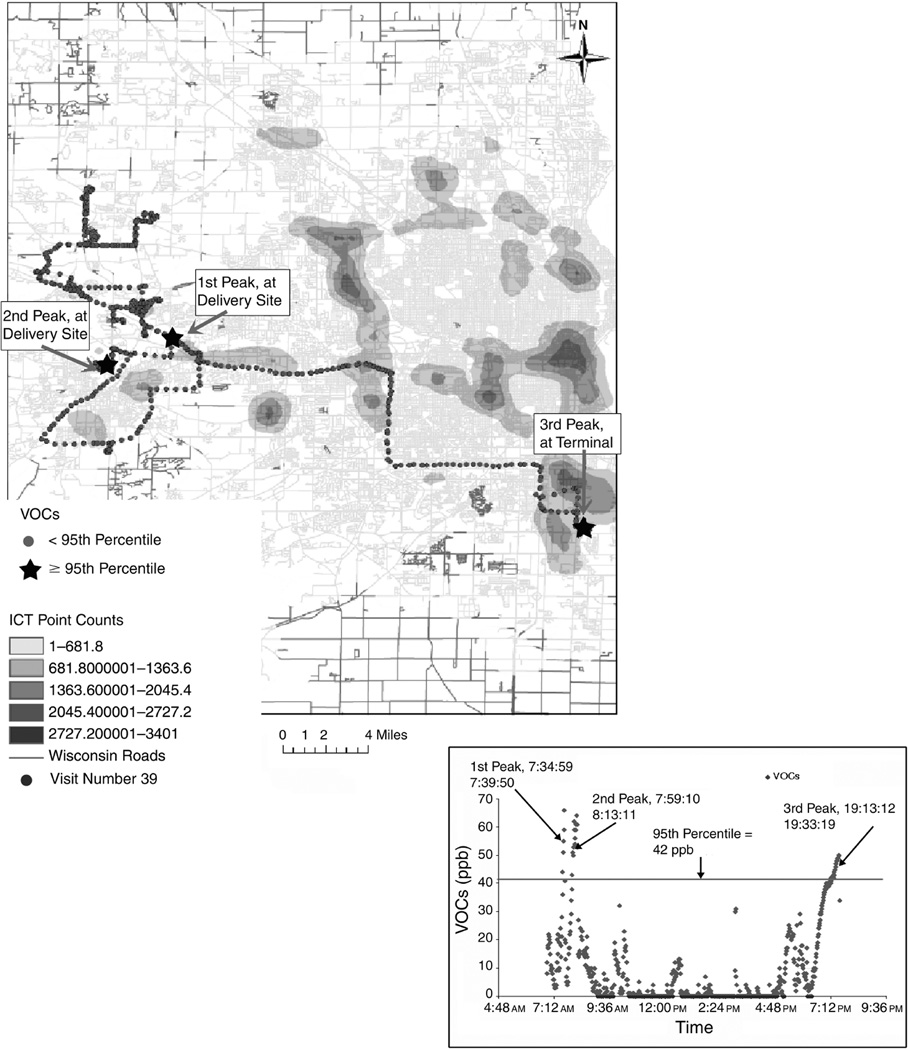
Results: Mean and median concentrations of VOCs across the sampling locations in and around the truck terminals showed significant variability in the upwind concentrations as well as in the intensity of exposures for drivers, loading-dock workers, and mechanics. The area of highest concentrations varied, although the lowest concentrations were always found in the upwind background samples. However, the downwind samples, which included the terminal's contribution, were on average only modestly higher than the upwind samples. In the truck terminal, the mechanic-shop-area concentrations were consistently elevated for many of the VOCs (including the xylenes, alkanes, and acetone) and particulates; the loading-dock concentrations had relatively high concentrations of 1,3-butadiene, formaldehyde, and acetaldehyde; and nonsmoking driver exposures were elevated for benzene, MTBE, styrene, and hexane. Also, the loading dock and yard background concentrations for EC and PM2.5 were highly correlated with many of the VOCs (50% of pairs tested with Spearman r > 0.5 and 75% with r > 0.4); in the mechanic shop VOCs were correlated with EC but not PM2.5 (r = 0.4-0.9 where significant); and for driver exposures VOC correlations with EC and PM2.5 were relatively low, with the exception of a few aromatics, primarily benzene (r = 0.4-0.5). A principal component analysis of background source characteristics across the terminal locations that had repeat site visits identified three different groupings of variables (the "components"). This analysis suggested that a strong primary factor for hydrocarbons (alkanes and aromatics) was the major contributor to VOC variability in the yard upwind measurement. Aldehydes and acetone, which loaded onto the second and third components, were responsible for a smaller contribution to VOC variability. A multi-layer exposure model was constructed using structural equation modeling techniques that significantly predicted the yard upwind concentrations of individual VOCs as a function of wind speed, road proximity, and regional location (R2 = 0.5-0.9). This predicted value for the yard background concentration was then used to calculate concentrations for the loading dock and mechanic shop. Finally, we conducted a detailed descriptive analysis of the real-time data collected in the yard and in truck cabs during the six repeat site visits, which included more than 50 12-hour sessions at each sampling location. The real-time yard monitoring results suggested that under some conditions there was a clear upwind-to-downwind trend indicating a terminal contribution, which was not apparent in the integrated sampling data alone. They also suggested a nonlinear relationship with wind speed: calm conditions (wind speed < 2 mph) were associated with erratic upwind-downwind differences, lower wind speeds (2 to 10 mph) favored transport with little dilution, and higher wind speeds (> 10 mph) favored dilution and dispersal (more so for VOCs than for PM). Finally, an analysis of the real-time data for driver exposures in trucks with a global positioning system (GPS) matched with geographic information system (GIS) data suggested a clear influence of traffic and industrial sources along a given route with peaks in driver exposures. These peaks were largely associated with traffic, major intersections, idling at the terminals, and pickup and delivery (P&D) periods. However, VOCs and PM2.5 had different exposure patterns: VOCs exposures increased when the vehicle was stopped, and PM2.5 exposures increased during travel in traffic.
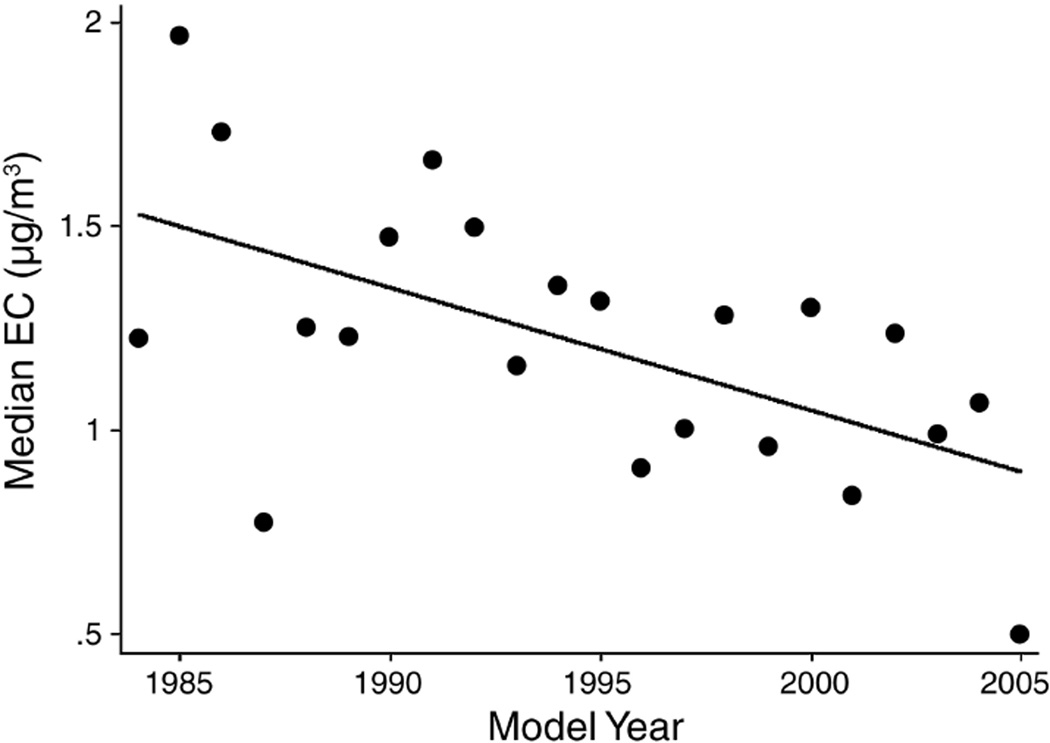
Conclusions: All three types of testing sites--upwind and downwind fence-line locations and inside truck cabs while in heavy traffic--met the established definition for a hot spot by having periods with concentrations of pollutants that exceeded the EPA's screening values. Most frequently, the pollutants with concentrations exceeding the screening values were formaldehyde, acetaldehyde, and EC (which serves as a marker for diesel particulate); less frequently they were 1,3-butadiene and benzene. In the case of the downwind location of a single truck terminal without an aggregation of other sources, high concentrations of VOCs and PM were infrequent. Using structural equation modeling, a model was developed that could identify combinations of conditions and factors likely to produce hot spots. Source apportionment analyses showed that EC came predominantly from diesel emissions. As expected from the sites studied, organic vapors associated with vehicle emissions (C6-C8 alkanes and aromatics) were the predominant components of VOCs, followed by formaldehyde and acetaldehyde. For driver exposures, high VOC values were associated with stopped vehicles, and high PM2.5 values were associated with conditions during driving.
Figures

Similar articles
-
Air toxics exposure from vehicle emissions at a U.S. border crossing: Buffalo Peace Bridge Study.Res Rep Health Eff Inst. 2011 Jul;(158):5-132. Res Rep Health Eff Inst. 2011. PMID: 21913504 Free PMC article.
-
Personal and ambient exposures to air toxics in Camden, New Jersey.Res Rep Health Eff Inst. 2011 Aug;(160):3-127; discussion 129-51. Res Rep Health Eff Inst. 2011. PMID: 22097188
-
Real-World Vehicle Emissions Characterization for the Shing Mun Tunnel in Hong Kong and Fort McHenry Tunnel in the United States.Res Rep Health Eff Inst. 2019 Mar;2019(199):5-52. Res Rep Health Eff Inst. 2019. PMID: 31663714 Free PMC article.
-
Chemicals in European residences - Part I: A review of emissions, concentrations and health effects of volatile organic compounds (VOCs).Sci Total Environ. 2022 Sep 15;839:156201. doi: 10.1016/j.scitotenv.2022.156201. Epub 2022 May 24. Sci Total Environ. 2022. PMID: 35623519
-
A review of personal exposure studies in selected Asian countries' public transport microenvironments: lessons learned and future directions.Environ Sci Pollut Res Int. 2023 Dec;30(58):121306-121337. doi: 10.1007/s11356-023-30923-9. Epub 2023 Nov 22. Environ Sci Pollut Res Int. 2023. PMID: 37993649 Review.
Cited by
-
Chemoresistance to Cancer Treatment: Benzo-α-Pyrene as Friend or Foe?Molecules. 2018 Apr 17;23(4):930. doi: 10.3390/molecules23040930. Molecules. 2018. PMID: 29673198 Free PMC article.
-
In utero exposure to toxic air pollutants and risk of childhood autism.Epidemiology. 2014 Nov;25(6):851-8. doi: 10.1097/EDE.0000000000000150. Epidemiology. 2014. PMID: 25051312 Free PMC article.
-
Different occupations associated with amyotrophic lateral sclerosis: is diesel exhaust the link?PLoS One. 2013 Nov 11;8(11):e80993. doi: 10.1371/journal.pone.0080993. eCollection 2013. PLoS One. 2013. PMID: 24244728 Free PMC article.
-
Peak Inhalation Exposure Metrics Used in Occupational Epidemiologic and Exposure Studies.Front Public Health. 2021 Jan 8;8:611693. doi: 10.3389/fpubh.2020.611693. eCollection 2020. Front Public Health. 2021. PMID: 33490023 Free PMC article. Review.
References
-
- Anderson MJ, Miller SL, Milford JB. Source apportionment of exposure to toxic volatile organic compounds using positive matrix factorization. J Expo Anal Environ Epidemiol. 2001;11:295–307. - PubMed
-
- Arif AA, Shah SM. Association between personal exposure to volatile organic compounds and asthma among US adult population. Int Arch Occup Environ Health. 2007;80:711–719. - PubMed
-
- Birch ME, Cary RA. Elemental carbon-based method for occupational monitoring of particulate diesel exhaust: Methodology and exposure issues. Analyst. 1996;121:1183–1190. - PubMed
-
- Brunekreef B, Janssen NA, de Hartog J, Harssema H, Knape M, van Vliet P. Air pollution from truck traffic and lung function in children living near motorways. Epidemiology. 1997;8:298–303. - PubMed
OTHER PUBLICATIONS RESULTING FROM THIS RESEARCH
-
- Davis ME, Laden F, Hart JE, Garshick E, Blicharz AP, Smith TJ. Particulate matter exposure over time in the US trucking industry. Environ Sci Technol. 2009;6:396–403.
Publication types
MeSH terms
Substances
Grants and funding
LinkOut - more resources
Full Text Sources
Medical
Research Materials
Miscellaneous