

Src-mediated morphology transition of lung cancer cells in three-dimensional organotypic culture
- PMID: 23409704
- PMCID: PMC3626791
- DOI: 10.1186/1475-2867-13-16
Src-mediated morphology transition of lung cancer cells in three-dimensional organotypic culture
Abstract
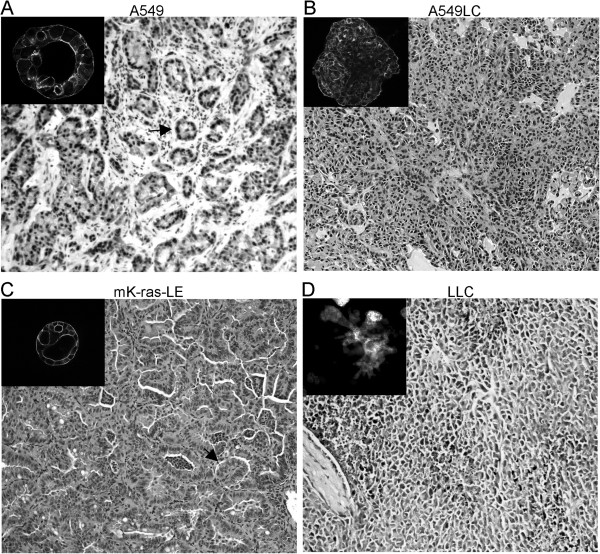
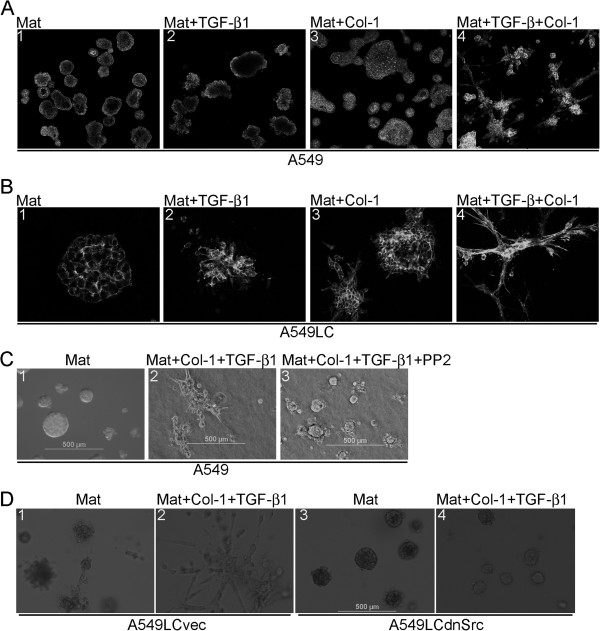
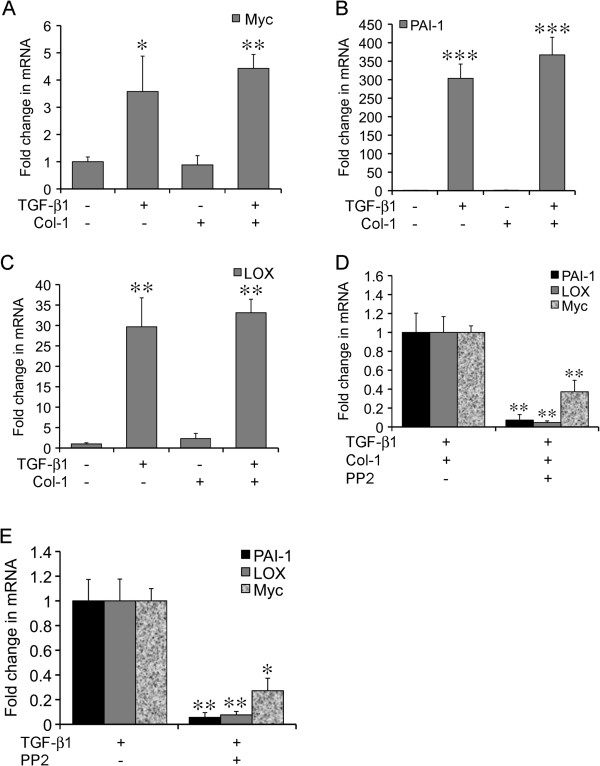
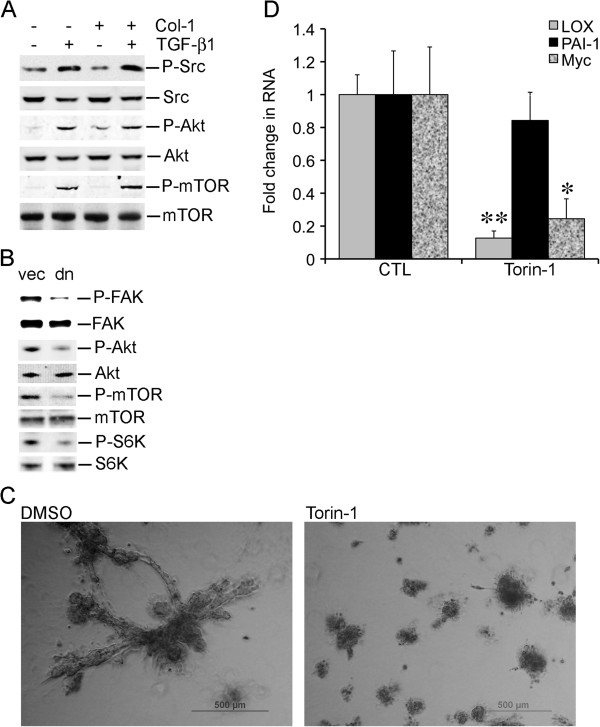
A fribotic tumor microenvironment promotes progression of cancer. In this study, we utilize a reconstituted basement membrane mimics Matrigel based three-dimensional organotypic culture (rBM 3-D) to investigate the mechanisms that mediate the tumor promoting effects of the fibrogenic mediators TGF-β1 and type I collagen (Col-1) on lung adenocarcinoma cells. Similar to normal alveolar epithelial cells, the well-differentiated lung adenocarcinoma cells in rBM 3-D culture undergo acinar morphogeneis that features polarized epithelial cell spheres with a single central lumen. Either TGF-β1 or Col-1 modestly distorts acinar morphogenesis. On the other hand, TGF-β1 and Col-1 synergistically induce a transition from acinar morphology into stellate morphology that is characteristic of invasive and metastatic cancer cells. Inhibition of the Src kinase activity abrogates induction of stellate morphology, activation of Akt and mTOR, and the expression of tumor promoting genes by TGF-β1 and Col-1. To a similar extent, pharmacological inhibition of mTOR abrogates the cellular responses to TGF-β1 and Col-1. In summary, we demonstrate that TGF-β1 and Col-1 promote stellate morphogenesis of lung cancer cells. Our findings further suggest that the Src-Akt-mTOR axis mediates stellate morphogenesis. These findings also indicate that rBM 3-D culture can serve as an ideal platform for swift and cost-effective screening of therapeutic candidates at the interface of the tumor and its microenvironment.
Figures
Similar articles
-
The microRNA expression associated with morphogenesis of breast cancer cells in three-dimensional organotypic culture.Oncol Rep. 2012 Jul;28(1):117-126. doi: 10.3892/or.2012.1764. Epub 2012 Apr 19. Oncol Rep. 2012. PMID: 22576799 Free PMC article.
-
Comparative profiling of miRNA expression of lung adenocarcinoma cells in two-dimensional and three-dimensional cultures.Gene. 2012 Dec 15;511(2):143-50. doi: 10.1016/j.gene.2012.09.093. Epub 2012 Oct 2. Gene. 2012. PMID: 23036707 Free PMC article.
-
Induction of long intergenic non-coding RNA HOTAIR in lung cancer cells by type I collagen.J Hematol Oncol. 2013 May 13;6:35. doi: 10.1186/1756-8722-6-35. J Hematol Oncol. 2013. PMID: 23668363 Free PMC article.
-
Src Homology 2 Domain-Containing Inositol 5'-Phosphatase Ameliorates High Glucose-Induced Extracellular Matrix Deposition via the Phosphatidylinositol 3-Kinase/Protein Kinase B Pathway in Renal Tubular Epithelial Cells.J Cell Biochem. 2017 Aug;118(8):2271-2284. doi: 10.1002/jcb.25881. Epub 2017 Feb 28. J Cell Biochem. 2017. PMID: 28075049
-
The role of contextual signal TGF-β1 inducer of epithelial mesenchymal transition in metastatic lung adenocarcinoma patients with brain metastases: an update on its pathological significance and therapeutic potential.Contemp Oncol (Pozn). 2019;23(4):187-194. doi: 10.5114/wo.2019.91543. Epub 2019 Dec 30. Contemp Oncol (Pozn). 2019. PMID: 31992949 Free PMC article. Review.
Cited by
-
Induction of HOXA9 expression in three-dimensional organotypic culture of the Claudin-low breast cancer cells.Oncotarget. 2016 Aug 9;7(32):51503-51514. doi: 10.18632/oncotarget.10491. Oncotarget. 2016. PMID: 27409175 Free PMC article.
-
lincRNA HOTAIR as a novel promoter of cancer progression.J Can Res Updates. 2014 Jul;3(3):134-140. doi: 10.6000/1929-2279.2014.03.03.3. J Can Res Updates. 2014. PMID: 25663954 Free PMC article.
-
Functions of lncRNA HOTAIR in lung cancer.J Hematol Oncol. 2014 Dec 10;7:90. doi: 10.1186/s13045-014-0090-4. J Hematol Oncol. 2014. PMID: 25491133 Free PMC article. Review.
-
Induction of a novel isoform of the lncRNA HOTAIR in Claudin-low breast cancer cells attached to extracellular matrix.Mol Oncol. 2017 Dec;11(12):1698-1710. doi: 10.1002/1878-0261.12133. Epub 2017 Oct 30. Mol Oncol. 2017. PMID: 28846832 Free PMC article.
-
Soluble ECM promotes organotypic formation in lung alveolar model.Biomaterials. 2022 Apr;283:121464. doi: 10.1016/j.biomaterials.2022.121464. Epub 2022 Mar 16. Biomaterials. 2022. PMID: 35306229 Free PMC article.
References
LinkOut - more resources
Full Text Sources
Other Literature Sources
Molecular Biology Databases
Miscellaneous
