. 2013 Feb 14:12:12.
doi: 10.1186/1476-4598-12-12.

Head and neck cancer cells and xenografts are very sensitive to palytoxin: decrease of c-jun n-terminale kinase-3 expression enhances palytoxin toxicity

Affiliations

Head and neck cancer cells and xenografts are very sensitive to palytoxin: decrease of c-jun n-terminale kinase-3 expression enhances palytoxin toxicity

Tibor Görögh et al. Mol Cancer. .

Abstract

Objectives: Palytoxin (PTX), a marine toxin isolated from the Cnidaria (zooanthid) Palythoa caribaeorum is one of the most potent non-protein substances known. It is a very complex molecule that presents both lipophilic and hydrophilic areas. The effect of PTX was investigated in a series of experiments conducted in head and neck squamous cell carcinoma (HNSCC) cell lines and xenografts.

Materials and methods: Cell viability, and gene expression of the sodium/potassium-transporting ATPase subumit alpha1 (ATP1AL1) and GAPDH were analyzed in HNSCC cells and normal epithelial cells after treatment with PTX using cytotoxicity-, clonogenic-, and enzyme inhibitor assays as well as RT-PCR and Northern Blotting. For xenograft experiments severe combined immunodeficient (SCID) mice were used to analyze tumor regression. The data were statistically analyzed using One-Way Annova (SPSS vs20).

Results: Significant toxic effects were observed in tumor cells treated with PTX (LD50 of 1.5 to 3.5 ng/ml) in contrast to normal cells. In tumor cells PTX affected both the release of LDH and the expression of the sodium/potassium-transporting ATPase subunit alpha1 gene suggesting loss of cellular integrity, primarily of the plasma membrane. Furthermore, strong repression of the c-Jun N-terminal kinase 3 (JNK3) mRNA expression was found in carcinoma cells which correlated with enhanced toxicity of PTX suggesting an essential role of the mitogen activated protein kinase (MAPK)/JNK signalling cascades pathway in the mechanisms of HNSCC cell resistance to PTX. In mice inoculated with carcinoma cells, injections of PTX into the xenografted tumors resulted within 24 days in extensive tumor destruction in 75% of the treated animals (LD50 of 68 ng/kg to 83 ng/kg) while no tumor regression occurred in control animals.

Conclusions: These results clearly provide evidence that PTX possesses preferential toxicity for head and neck carcinoma cells and therefore it is worth further studying its impact which may extend our knowledge of the biology of head and neck cancer.


Figures

Figure 1
Figure 1
Analysis of cell morphology and effect of PTX on high-density cell cultures. (A) Typical morphological appearance of PTX untreated UKHN-6 cells. (B-E) Dose-dependent morphological alterations of the carcinoma cells. (B) At 1 ng/ml PTX the cells begin to disintegrate, reflected by initiation of cellular swelling (arrows). (C) Swelling process is advanced in all cells at 2 ng/ml PTX. (D) Cellular damage is spreading throughout the cells at 3 ng/ml PTX, shown by high grade of flattening. (E) At 4 ng/ml PTX cells are detached from the culture surface and are completely destroyed (F), whereas no morphological changes are recognizable in normal epithelial cells at this concentration (F). (G) Release of LDH from carcinoma cells (▲) and normal epithelial cells (Δ) shown in Fig. B-E and F respectively. (H and I) Effect of PTX on high-density cell cultures utelising cytotoxicity and clonogenic assays. UKHN-1 (○), UKHN-2 (●), and UKHN-3 (□) tumor cells, and normal epithelial cells (■) were used. (H) Cell survival was determined by using the crystal violet assay. Percentages indicate the amount of surviving cells after treatment with different PTX concentrations. (I) Percent survival of PTX treated cells shown in H. Data represent the mean ± SD of triplicate experiments.
Figure 2
Figure 2
Tumor development in SCID mice. Starting on day 14 (vertical broken line), mice received intraperitoneal (●) and intratumoral (■) injections of PTX as well as intratumoral (▲) injections of PBS at three-day-intervals. From day 20 on the differences between the intratumoral and the intraperitoneal treated PTX receiving groups were significant (P < 0.05). Similarly, differences were observed when comparing the intratumoral PTX and the intratumoral PBS groups, where tumor sizes were significantly different (p<0.05) from day 20 on. In addition, at all time points measured, there were no significant differences in tumor size between the intratumoral PBS and the ip PTX group (p>0.05). Data represent mean tumor volume ± SD.
Figure 3
Figure 3
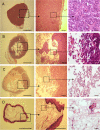
PTX administration into tumors growing in SCID mice. (A) PTX untreated tumor presenting consistent and extremely dense tumor mass. (B) 9 days after beginning of the experiment a loss of tumor mass was already visible. The periphery of tumor necrosis appears to be sharply delineated with loose tumor cell- and lymphoid cell aggregates. (C) After 15 days tumor destruction has further progressed, associated with diffuse lymphoid infiltrate. (D) The entire tumor inside has been destructed and only the rim of the tumor remained after 24 days. The inside of the tumor is presented by dense collagen fibers with singly scattered lymphoid aggregates. Representative examples of tumor sections from control and PTX-treated group are shown. Scale bars, 2 mm (left), 1 mm (middle), 100 μm (right).
Figure 4
Figure 4
ATP1AL1- and GAPDH-gene expressions in UKHN-2 cells. (A and B) Expression profiles of the ATP1AL1- and GAPDH-genes during exposure of the tumor cells to PTX of different concentrations. (C) Densitometric measurements of the relative gene expression detected by RT-PCR. Data represent mean ± SDs of triplicate measurements.
Figure 5
Figure 5
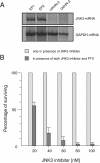
Repression of JNK3 protein kinase enhances PTX toxicity. (A) Northern Blot hybridization analysis of mRNA in normal epithelial cells (EP1 and EP2) and HNSCC cells (UKHN-2 and UKHN-3) using a JNK3 gene specific cDNA probe. GAPDH specific probe was used as a control for equal loading. (B) Human normal nasal epithelial cells were treated with JNK3 protein kinase selective inhibitor at concentrations ranging from 20 nM to 100 nM for 3 hours. Cells of the same origin were then treated under exactly the same conditions, and were subsequently exposed to 6 ng/ml of PTX for 24 hours. Cell survival was determined using the crystal violet assay as demonstrated in Figure 1/H. Percent survival of JNK3 inhibitor-treated cells and those treated with both JNK3 inhibitor and PTX are shown. Data are representative of four independent experiments represent mean ±SD.

Similar articles

Cited by

References

    1. Moore RE, Scheuer PJ. Palytoxin: A new marine toxin from a coelenterate. Science. 1971;172(3982):495–498. doi: 10.1126/science.172.3982.495. - DOI - PubMed
    1. Louzao MC, Espina B, Cagide E, Ares IR, Alfonso A, Vieytes MR. Cytotoxic effect of palytoxin on mussel. Toxicon. 2010;56(5):842–847. doi: 10.1016/j.toxicon.2010.02.027. - DOI - PubMed
    1. Kan Y, Uemura D, Hirata Y, Ishiguro M, Iwashita T. Complete NMR signal assignment of palytoxin and N-acetylpalytoxin. Tetrahedron Let. 2001;42(18):3197–3202. doi: 10.1016/S0040-4039(01)00407-5. - DOI
    1. Bignami GS, Senter PD, Grothaus PG, Fischer KJ, Humphreys T, Wallace PM. N-(4’-hydroxyphenylacetyl)palytoxin: a palytoxin prodrug that can be activated by a monoclonal antibody-penicillin g amidase conjugat. Cancer Res. 1992;52(20):5759–5764. - PubMed
    1. Habermann E. Palytoxin acts through Na+, K+, ATPase. Toxicon. 1989;27(11):1171–1187. doi: 10.1016/0041-0101(89)90026-3. - DOI - PubMed

Publication types

MeSH terms