

Alcohol outlets and binge drinking in urban neighborhoods: the implications of nonlinearity for intervention and policy
- PMID: 23409908
- PMCID: PMC3673248
- DOI: 10.2105/AJPH.2012.301203
Alcohol outlets and binge drinking in urban neighborhoods: the implications of nonlinearity for intervention and policy
Abstract
Objectives: Alcohol outlet density has long been associated with alcohol-related harms, and policymakers have endorsed alcohol outlet restriction to reduce these harms. However, potential nonlinearity in the relation between outlet density and alcohol consumption has not been rigorously examined.
Methods: We used data from the New York Social Environment Study (n = 4000) to examine the shape of the relation between neighborhood alcohol outlet density and binge drinking by using a generalized additive model with locally weighted scatterplot smoothing, and applied an imputation-based marginal modeling approach.
Results: We found a nonlinear relation between alcohol outlet density and binge drinking; the association was stronger at densities of more than 80 outlets per square mile. Binge drinking prevalence was estimated to be 13% at 130 outlets, 8% at 80 outlets, and 8% at 20 outlets per square mile.
Conclusions: This nonlinearity suggests that reductions in alcohol outlet density where density is highest and the association is strongest may have the largest public health impact per unit reduction. Future research should assess the impact of policies and interventions that aim to reduce alcohol outlet density, and consider nonlinearity in effects.
Figures
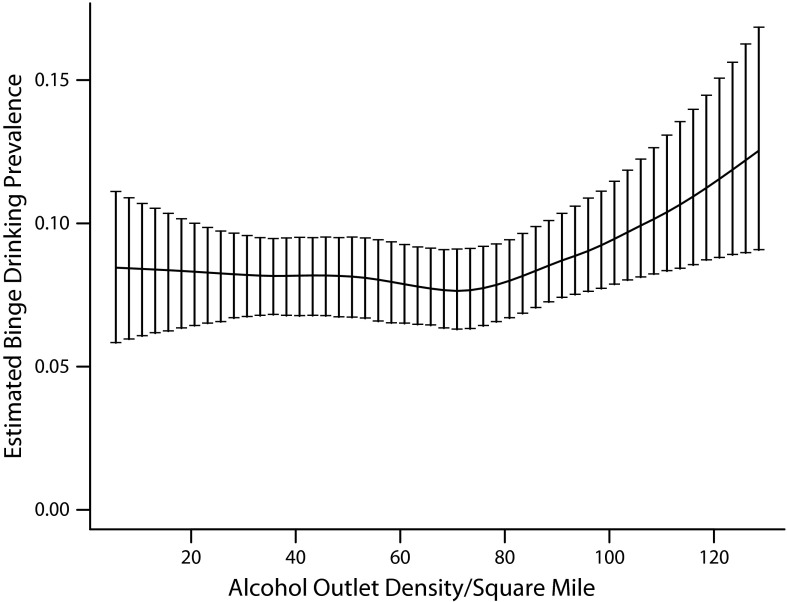
 , where A is alcohol outlet density and it is set to the value a, W is the vector of confounders, and Y is binge drinking. Whiskers indicate 95% confidence intervals.
References
-
- Gruenewald PJ, Johnson FW, Treno AJ. Outlets, drinking and driving: a multilevel analysis of availability. J Stud Alcohol. 2002;63(4):460–468 - PubMed
-
- Gruenewald PJ, Stockwell T, Beel A, Dyskin EV. Beverage sales and drinking and driving: the role of on-premise drinking places. J Stud Alcohol. 1999;60(1):47–53 - PubMed
-
- Scribner RA, MacKinnon DP, Dwyer JH. Alcohol outlet density and motor vehicle crashes in Los Angeles County cities. J Stud Alcohol. 1994;55(4):447–453 - PubMed
-
- Treno AJ, Johnson FW, Remer LG, Gruenewald PJ. The impact of outlet densities on alcohol-related crashes: a spatial panel approach. Accid Anal Prev. 2007;39(5):894–901 - PubMed
-
- Gruenewald PJ, Millar AB, Treno AJ, Yang Z, Ponicki WR, Roeper P. The geography of availability and driving after drinking. Addiction. 1996;91(7):967–983 - PubMed
Publication types
MeSH terms
Grants and funding
LinkOut - more resources
Full Text Sources
Other Literature Sources
