

Review
doi: 10.1021/cr300336e.
Epub 2013 Feb 14.
Single cell optical imaging and spectroscopy
Affiliations
- PMID: 23410134
- PMCID: PMC3624028
- DOI: 10.1021/cr300336e
Item in Clipboard
Review
Single cell optical imaging and spectroscopy
Chem Rev.
.
No abstract available
Figures

A schematic representation of the optical path in a point-scanning confocal fluorescence microscope. The collimated excitation beam (solid blue) is directed to the microscope objective by a dichroic mirror and focused onto the sample. The fluorescence signal (dashed blue) emanating from the sample in focus is collected by the same objective and imaged through a pinhole onto a detector. The off-focal plane signal (dashed red and green) is rejected by the pinhole.

Multifocal multiphoton microscopy. (A) A schematic of the multifocal multiphoton microscopy setup. (B) Depth resolved image of GFP-expressing neurons in the ex vivo mouse brain. Improvement of image quality is obvious if signal is detected using a multianode PMT. Image size 320 × 320 pixels, frame rate 0.3 frames/ second. Objective used: 20x, water immersion, NA 0.95. Reprinted with permission from ref 122. Copyright 2011 Optical Society of America.

Super-resolution microscopy. Upper panel: principles of super-resolution microscopy techniques. Lower panel: confocal and super-resolution images of fluorescent protein labeled microtubules in living cells, showing SIM of EGFP-tubulin in a living Drosophila S2 cell (adapted with permission from ref 149; copyright 2009 Nature Publication Group), confocal and STED microscopy of mCitrine-tubulin in a living PtK2 cell (adapted with permission from ref 156; copyright 2008 National Academy of Sciences), and STORM/PALM/FPALM of mEos2-tubulin in a living Drosophila S2 cell (image acquired by Bo Huang), respectively. All images are shown with the same magnification. Scale bars: 2 μm.

Various TIRFM and VAEM configurations. (A) Epi-fluorescence. (B) Objective-based VAEM. (C) Objective-based TIRFM. Reprinted with permission from ref 210. Copyright 2008 Blackwell Publishing Ltd. (D) Prism-based VAEM. The objective scanner facilitates vertical sectioning of the sample. Reprinted with permission from ref 213. Copyright 2011 Elsevier. The components are not drawn to scale.

Analysis of subcellular organelle markers by epifluorescence and TIRFM in roots. Arabidopsis roots imaged using epifluorescence and TIRFM. (a) mGFP5-ER (ER marker); (b) N84728 (ER marker). Individual ER structures and the presence of extended cisternal lamellae connected to a tubular ER network can only be distinguished in the TIRF images (asterisks, ER cisternae; arrow, ER tubules); (c) N84733 (chromosome marker). Scale bars in left and middle column represent 10 μm. Scale bars in rightmost column represent 5 μm. Reprinted with permission from ref 240. Copyright 2011 Oxford University Press.

Schematic of a typical LSM. Laser illumination passes through a beam expander (BE), shaped by the cylindrical lens (CL), and passes through the sample (S). Emitted light is collected by the objective (OBJ) and recorded by the camera (CCD). Boxed region is a close-up of the sample holder depicting its degrees of freedom during image acquisition.

3D isotropic imaging of live-cell dynamics. (a) Images of ER in a live U2OS cell, visualized in the Bessel multiharmonic 9 phase SI mode, over 45 image volumes: representation of a subset of the 321 image planes (brown lines) comprising each volume (top); images from three indicated image planes; and image volumes after 10 and 30 min of observation. (b) Filopodia at the apical surface of a live HeLa cell, visualized in the Bessel TPE sheet mode over three consecutive image volumes from 100 such volumes taken at 6-s intervals. Filaments that wave (magenta and yellow arrowheads), extend outward (cyan arrowhead) or retract inward (green arrowhead) are marked. (c) African green monkey kidney cell (COS-7) transfected with plasmids encoding mEmerald-c-Src, demonstrating retrograde flow of membrane ruffles (left) and vacuole formation by macropinocytosis (right; arrowheads) in an exemplary plane in a translucent cell view (top). All data were extracted from 73 image stacks taken at 12-s intervals. Scale bars, 5 μm (a, b) and 10 μm (c). Reprinted with permission from ref 267. Copyright 2011 Nature Publishing Group.

(A) Schematics of dual FRET FP probes for sensing Ca2+ and Ras activation. (B) Absorption and emission spectra of the dual FRET donor and acceptor FPs and filters used by the authors (shaded wavelengths). Reprinted with permission from ref 356. Copyright 2008 Elsevier.

BODIPY donor/biphenyl linker/tetramethylrhodamine acceptor mercury ion FRET sensor imaged in HeLa cells. The cells were incubated with 2.5 μM FRET sensor for 15 minutes then imaged at the indicated times after introducing 2.5 μM HgCl2. The emission is red-shifted as energy is transferred from the donor (green emission) to the acceptor. Reprinted with permission from ref 375. Copyright 2011 John Wiley and Sons.
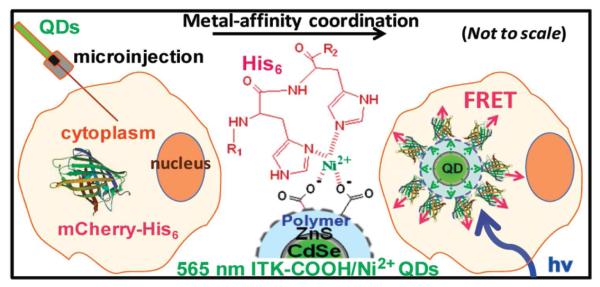
Schematic of a method to generate an intracellular QD-FP biosensor. Once injected into the cell, the Ni2+ containing QDs chelate the hexahistidine containing genetically expressed FP mCherry. FRET occurs between the QD donor and FP acceptor. Reprinted with permission from ref 390. Copyright 2010 American Chemical Society.

Optical imaging techniques for non-fluorescent nanoparticles: (A) Dark field microscopy. (B) Photothermal. Reprinted with permission from ref 438. Copyright 2005 American Chemical Society. (C) Interferometric cross-polarization microscopy. BS, beam splitter; AOM, acoustic-optical modulator; GT, Glan Taylor polarizer. Reprinted with permission from ref 455. Copyright 2011 American Chemical Society. (D) Differential interference contrast (DIC) microscopy. The arrows show the vibration directions of the light beams at different locations.

Monitoring the uptake of positive, negative, and neutrally charged SERS nanoprobes. (A) SERS spectra of 4-aminothiophenol sampled over three different locations in a macrophage cell. (B) Cellular distribution of the negatively charged 4-aminothiophenol labeled Ag nanoparticles in macrophage cells using SERS mapping. Reprinted with permission from ref 530. Copyright 2011 Elsevier.

Dynamic SERS imaging inside a living cell can provide local molecular information over microsecond intervals. (a) High temporal resolution Raman spectra collected at 50 ms intervals. The stationary peaks indicate the nanoparticle had prolonged interaction with the molecule and peaks appearing and disappearing indicate molecules short residence times. (b) Schematic of the nanoparticle with molecules passing by and molecules with prolonged interactions. (c) Example linear trajectory of a Au nanoparticle acquired during a dynamic SERS imaging experiment. Reprinted with permission from ref 572. Copyright 2011 American Chemical Society.

Dark field and DIC PSFs. (A) Example of a 2D slice through a Gaussian-shaped PSF generated by a gold nanoparticle. Inset: Dark field image of same gold nanoparticle. (B) Example of a 2D slice through a PSF generated by a gold nanoparticle under a DIC microscope. Inset: DIC image of same gold nanoparticle.

(A) Energy diagrams of SRS and CARS. (B) SRL imaging of deuterated palmitic acid-d31 in live CHO cells at CD stretch vibration and CH stretch vibration, respectively. Reprinted with permission from ref 587. Copyright 2011 American Chemical Society. (C) Simultaneous CARS imaging of axonal myelin (red) and TPEF imaging of Oregon green 488 (green). Reprinted with permission from ref 630. Copyright 2005 Biophysical Society. (D) SRS images of nucleic acids at 785 cm−1 in a salivary gland cell from Drosophila melanogaster, via the stimulated Raman loss detection scheme. Reprinted with permission from ref 640. Copyright 2012 WILEY-VCH Verlag GmbH & Co. KGaA, Weinheim. (E) CARS imaging of cellular uptake of 200-nm polystyrene nanoparticles encapsulated in folate-targeted liposomes (red) in KB cell. Reprinted with permission from ref 641. Copyright 2007 American Chemical Society. Scale bar: 10 μm.

3D tracking by manipulating focal or image planes. (A) Bifocal imaging. Reprinted with permission from ref 678. Copyright 2007 American Chemical Society. (B) Multifocal plane microscopy. Reprinted with permission from ref 679. Copyright 2008 Elsevier. (C) Scan-free multiplane detection. Reprinted with permission from ref 682. Copyright 2010 American Chemical Society. (D) Light split by a prism. Reprinted with permission from ref 683. Copyright 2008 Nature Publishing Group. (E) Light split by mirrors. Reprinted with permission from ref 684. Copyright 2009 American Chemical Society. (F) Overlapping confocal volume elements. Reprinted with permission from ref 685. Copyright 2010 American Chemical Society.

3D tracking by distorting image patterns. (A) Elliptical image patterns resulted from the introduction of astigmatism by a cylindrical lens. Reprinted with permission from ref 171. Copyright 2008 American Association for the Advancement of Science. (B) Engineered double-helix PSF by the SLM. Adapted with permission from ref 173. Copyright 2009 National Academy of Sciences.
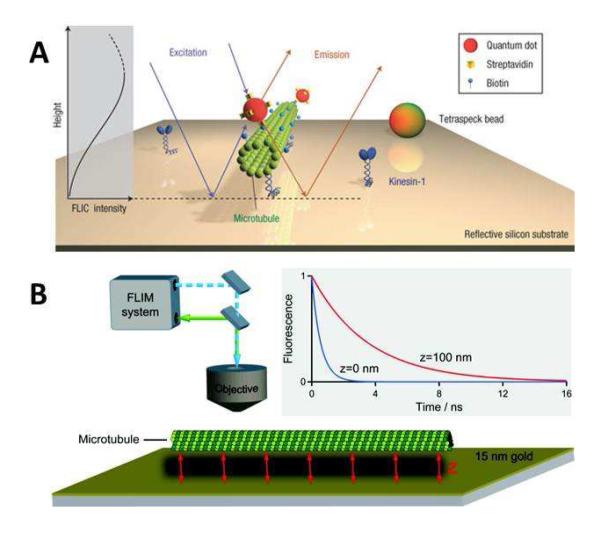
3D tracking near a surface. (A) FLIC. The direct excitation and emission light interfere with reflected light from the surface. Reprinted with permission from ref 691. Copyright 2008 Nature Publishing Group. (B) FLIM. The strong optical near-field coupling of fluorophores with the gold film results in the distance-dependent fluorescence lifetime. Reprinted with permission from ref 692. Copyright 2010 American Chemical Society.

3D superlocalization of gold nanospheres in DIC microscopy. (A) 3D model of a 40-nm gold nanosphere generated from a vertical scan. (B) Model-based 3D correlation map of a 40-nm gold nanosphere. The 3D model is used in the mapping process. (C) A reference particle (highlighted in red box) adsorbed on the coverslip. (D) The target gold nanosphere (highlighted in red box) on the cell membrane. The correlation map for this particle (the imbedded image) consists of a bright center and two dark side lobes, similar to the one shown in (A). Adapted with permission from ref 648. Copyright 2012 American Chemical Society.

Tracking gold nanorods using scattering-based imaging techniques. (A) Light sheet illumination. The in-plane polarized light sheet is generated by putting a polarizer behind a cylindrical lens. Two orthogonally polarized light sheets illuminate gold nanorods and the polarized scattering signals are resolved with a birefringent crystal. Reprinted with permission from ref 735. Copyright 2011 American Chemical Society. (B) Dual wavelength dark field microscopy. The focused 540-nm channel provides the localization information, while the defocused 700-nm channel provides the orientation information. Reprinted with permission from ref 736. Copyright 2012 Wiley-VCH Verlag & Co. KGaA.

DIC-based SPORT. (A) DIC images of two 25×73 nm gold nanorods in different orientations at the longitudinal SPR mode (720 nm) and the transverse SPR mode (540 nm). (B) Periodicity of the nanorod signal intensities. The angular resolution for these DIC images is ~2°. (C) Definition of in-plane orientation angle ϕ. The x and y-axes are the polarization directions of the two beams passing through the specimen. The nanorod’s long axis is p and the cross-section axis is s. Adapted with permission from ref 462. Copyright 2010 American Chemical Society. (D) TEM and DIC images of the four nanorod features. P: proximate nanorods; D: dimer; N1 and N2: single, isolated nanorods. All four features give different DIC intensity patterns. (E) The proximate nanorods (Feature P in (D)) show orientation-dependent DIC images that match well with the simulated image patterns. The distance between these two particles (180 nm tip-to-tip and 227 nm center-to-center) are less than the diffraction limit. Adapted with permission from ref 408. Copyright 2010 American Chemical Society. (F) Dual-modality SPORT enables dynamic tracking of gold nanorods transported on the fluorescently-labeled microtubule network in live cells. Adapted with permission from ref 740. Copyright 2012 American Chemical Society. (G) Four different image patterns appear for a gold nanorod that is tilted with respect to the horizontal object plane. Reprinted with permission from ref 743. Copyright 2012 Wiley-VCH Verlag & Co. KGaA.
References
-
- Hooke R, Micrographia Or. Some Physiological Descriptions of Minute Bodies Made by Magnifying Glasses, with Observations and Inquiries Thereupon: By Robert Hooke ; with a Preface by R.T. Gunther. Dover Publications; New York: 2003.
-
- Chou LYT, Ming K. Chem. Soc. Rev. 2011;40:233. - PubMed
-
- Delehanty J, Mattoussi H, Medintz I. Anal. Bioanal. Chem. 2009;393:1091. - PubMed
Publication types
MeSH terms
Substances
Grants and funding
LinkOut - more resources
Full Text Sources
Other Literature Sources
