. 2013 May;182(2):93-105.
doi: 10.1016/j.jsb.2013.01.011. Epub 2013 Feb 11.

Projection-based volume alignment

Affiliations

Projection-based volume alignment

Lingbo Yu et al. J Struct Biol. 2013 May.

Abstract

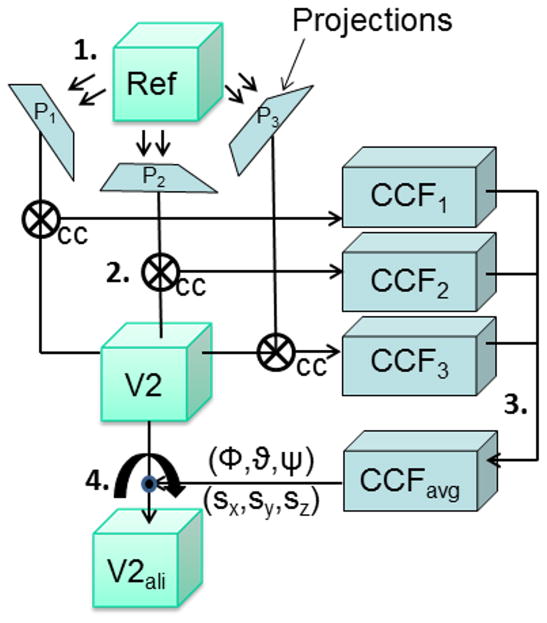
When heterogeneous samples of macromolecular assemblies are being examined by 3D electron microscopy (3DEM), often multiple reconstructions are obtained. For example, subtomograms of individual particles can be acquired from tomography, or volumes of multiple 2D classes can be obtained by random conical tilt reconstruction. Of these, similar volumes can be averaged to achieve higher resolution. Volume alignment is an essential step before 3D classification and averaging. Here we present a projection-based volume alignment (PBVA) algorithm. We select a set of projections to represent the reference volume and align them to a second volume. Projection alignment is achieved by maximizing the cross-correlation function with respect to rotation and translation parameters. If data are missing, the cross-correlation functions are normalized accordingly. Accurate alignments are obtained by averaging and quadratic interpolation of the cross-correlation maximum. Comparisons of the computation time between PBVA and traditional 3D cross-correlation methods demonstrate that PBVA outperforms the traditional methods. Performance tests were carried out with different signal-to-noise ratios using modeled noise and with different percentages of missing data using a cryo-EM dataset. All tests show that the algorithm is robust and highly accurate. PBVA was applied to align the reconstructions of a subcomplex of the NADH: ubiquinone oxidoreductase (Complex I) from the yeast Yarrowia lipolytica, followed by classification and averaging.


Figures

Figure 1
Figure 1
Alignment of two volumes by projection matching, shown here for only three projections. The main steps are numbered. (1) The reference volume is projected along three directions, onto the projections, P1, P2 and P3. (2) Each projection then is matched to the second volume (V2) by a cross-correlation algorithm (cc). (3) The cross-correlation functions (CCFi) are averaged, and the maximum of the averaged cross-correlation indicates the rotation of the second volume. The 2D translation vectors from all projections are combined into a 3D vector that describes the translational difference between the two volumes. (4) Rotation and translation parameters are applied to (V2) to obtain the aligned volume (V2ali).
Figure 2
Figure 2
Localization of missing data regions using the line variance of the Radon transform. a) Average image of a subcomplex of complex I from Y. lipolytica also used in section 4. b) Radon transform of the image. Angular coordinate Φ from 0° to 180°, radial coordinate ρ. The vertical arrow indicates a line along which the standard deviation is calculated. Standard deviation values are stored at the end of each line of the transform indicated by the dotted line in the margin below (b). c) The same Radon transform with 1/3 of the data set to 0 (33% missing data). d) r*-weighted back-projection calculated from the Radon transform with missing data. e) Radon transform calculated from the reconstructed image in (d). Note that the missing data are not 0 anymore but instead the transform shows data with a blurred appearance in the corresponding area. f) Plot of the standard deviations of the values in the radial lines of a Radon transform versus angle, calculated from a ρ high-pass filtered version of the 2D Radon transforms shown in (c), solid line and (e) dashed line, ρ* being the radial coordinate in the Fourier transform. The missing data area can be detected from the standard deviation values that fall below a certain threshold. Scale bars 100Å.
Figure 3
Figure 3
Test data sets: a) complex I of Y. lipolytica; b) an example image at SNR=0.33; c) S. cerevisiae PFK in the presence of ATP; d) an example cryo-EM image. Scale bars 100Å.
Figure 4
Figure 4
10 reconstructions of subcomplex Δ NB8M of complex I from Y. lipolytica reconstructed using RCT. Row numbers indicate volume number, used in the text and in Figure 5. Column a: Reconstructions of the 10 classes originally obtained after classification of the 0° data. Column b: The reconstructions after alignment by PBVA using volume 1 as reference. Column c: The reconstructions after estimation of the missing data as part of the PPCA-EM algorithm. Scale bar 100 Å.
Figure 5
Figure 5
Scatter plot of the 10 volumes. PPCA-EM was applied to the aligned volumes, shown is the non-linear map obtained from the coordinates in the first 3 eigenvectors. The numbers corresponds to the volumes numbers in Figure 4. Distances scaled by 10−4.
Figure 6
Figure 6
Final 3D reconstruction of subcomplex Δ NB8M of complex I from Y. lipolytica a) Average structure of volumes 1 to 6; b) FSC of the average structure showing resolutions of 23.2Å at a cutoff of 0.3 (~24.4Å at a cutoff of 0.5).

References

    1. Bartesaghi A, Sprechmann P, Liu J, Randall G, Sapiro G, Subramaniam S. Classification and 3D averaging with missing wedge correction in biological electron tomography. J Struct Biol. 2008;162:436–450. - PMC - PubMed
    1. Clason T, Zickermann V, Ruiz T, Brandt U, Radermacher M. Direct localization of the 51 and 24 kDa subunits of mitochondrial complex I by three-dimensional difference imaging. Journal of Structural Biology. 2007;159:433–442. - PMC - PubMed
    1. Crowther RA, DeRosier DJ, Klug A. The reconstruction of a three-dimensional structure from its projections and its applications to electron microscopy. Proc R Soc London. 1970;A317:319–340.
    1. Deans SR. The Radon Transform and some of Its Applications. John Wiley & Sons; New York: 1983.
    1. Dröse S, Krack S, Sokolova L, Zwicker K, Barth H-D, Morgner N, Heide H, Steger M, Nübel E, Zickermann V, Kerscher S, Brutschy B, Radermacher M, Brandt U. Functional Dissection of the Proton Pumping Modules of Mitochondrial Complex I. PLoS biology. 2011:9. - PMC - PubMed

Publication types

MeSH terms

Substances

LinkOut - more resources