. 2013 Feb 11;23(2):200-14.
doi: 10.1016/j.ccr.2013.01.011.

Growth factor independence 1 antagonizes a p53-induced DNA damage response pathway in lymphoblastic leukemia

Affiliations

Growth factor independence 1 antagonizes a p53-induced DNA damage response pathway in lymphoblastic leukemia

Cyrus Khandanpour et al. Cancer Cell. .

Abstract

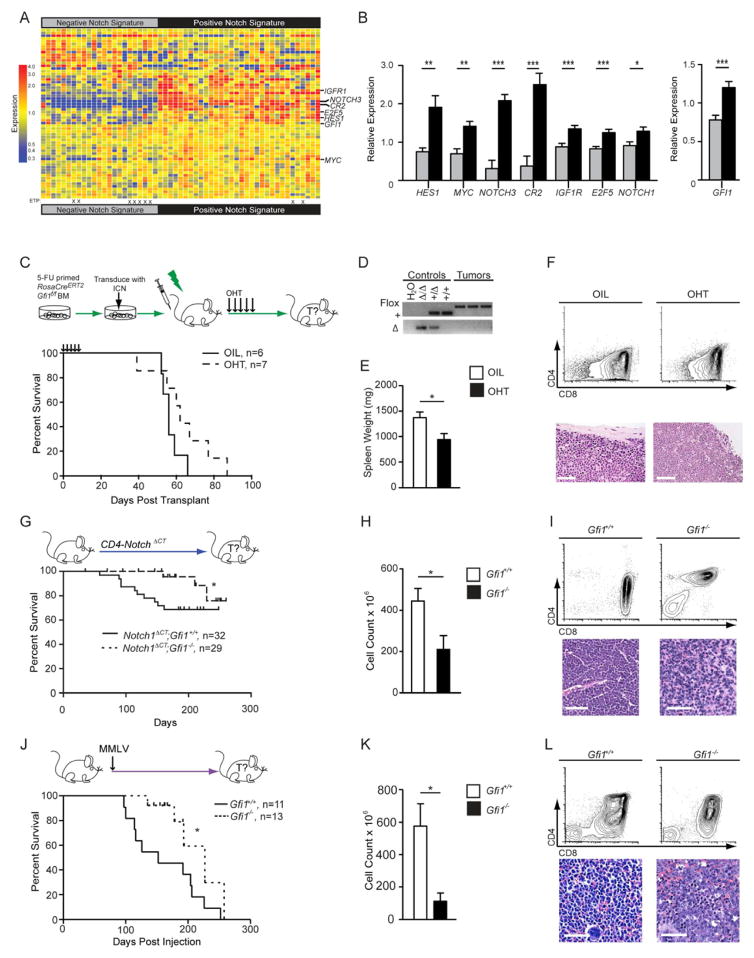
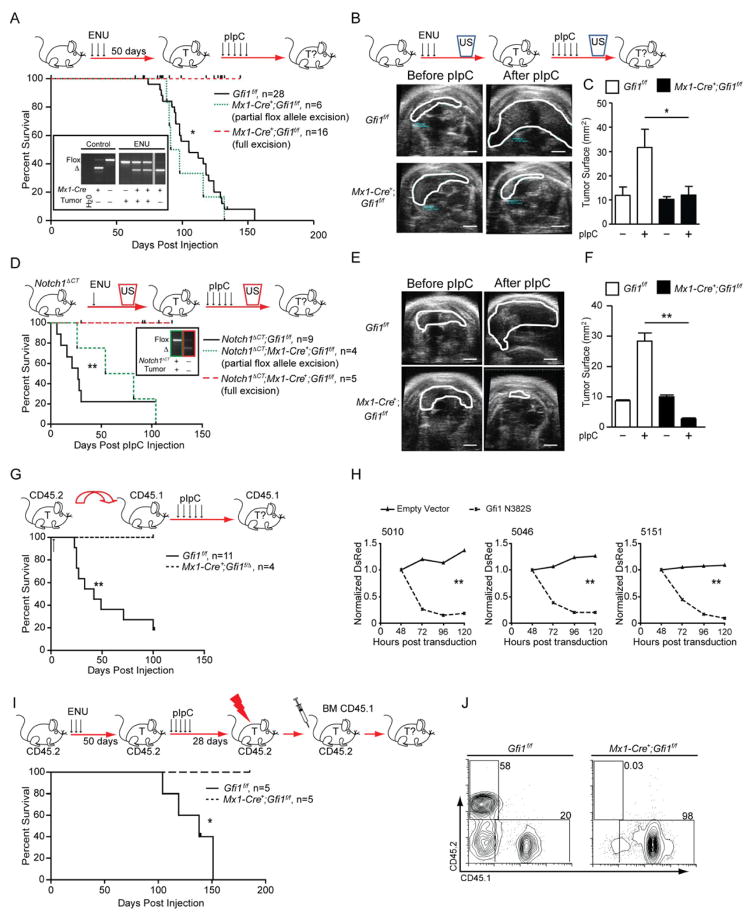
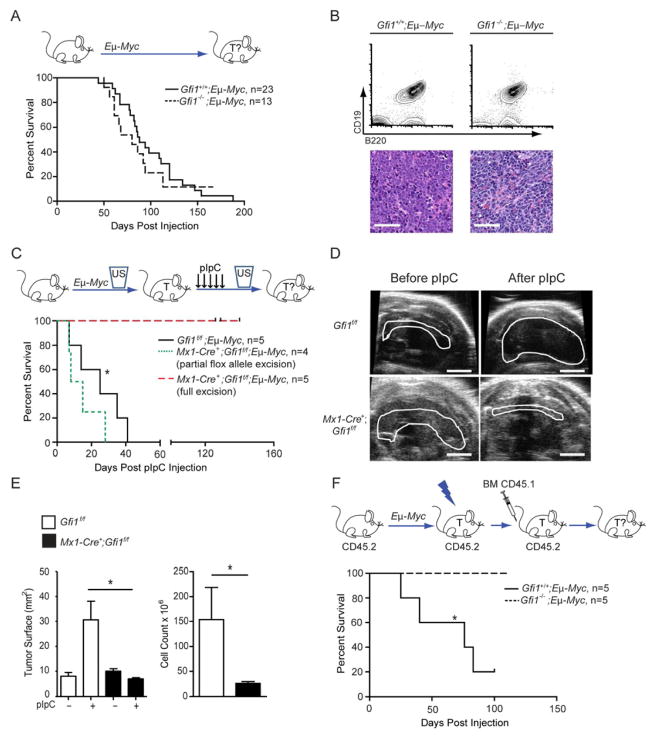
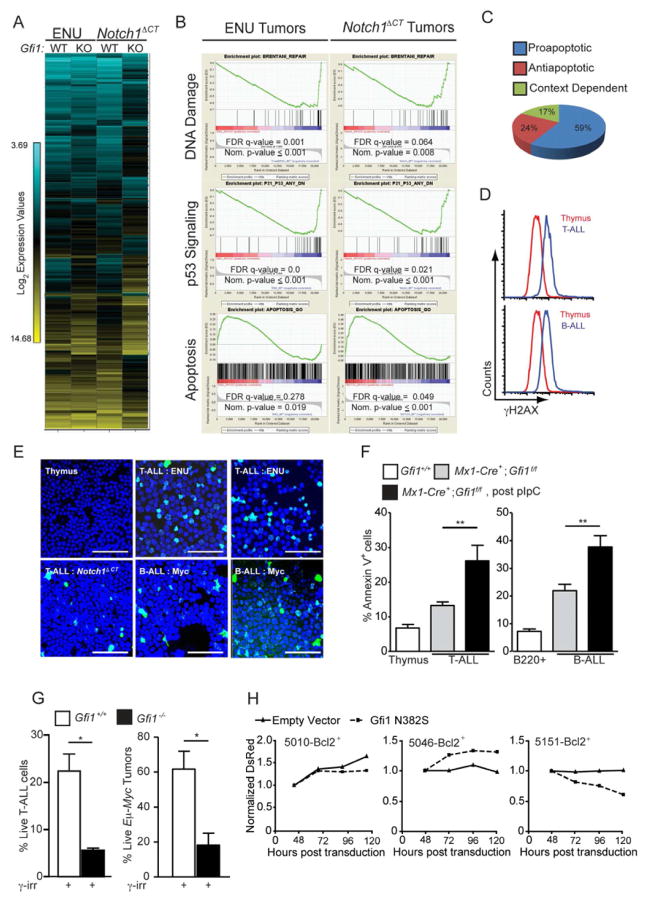
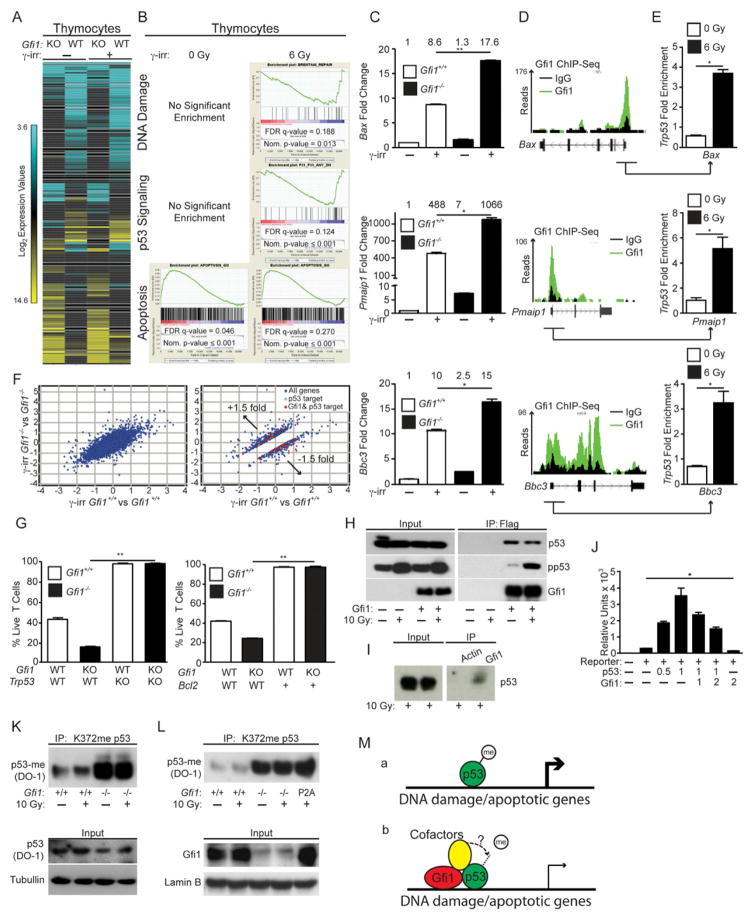
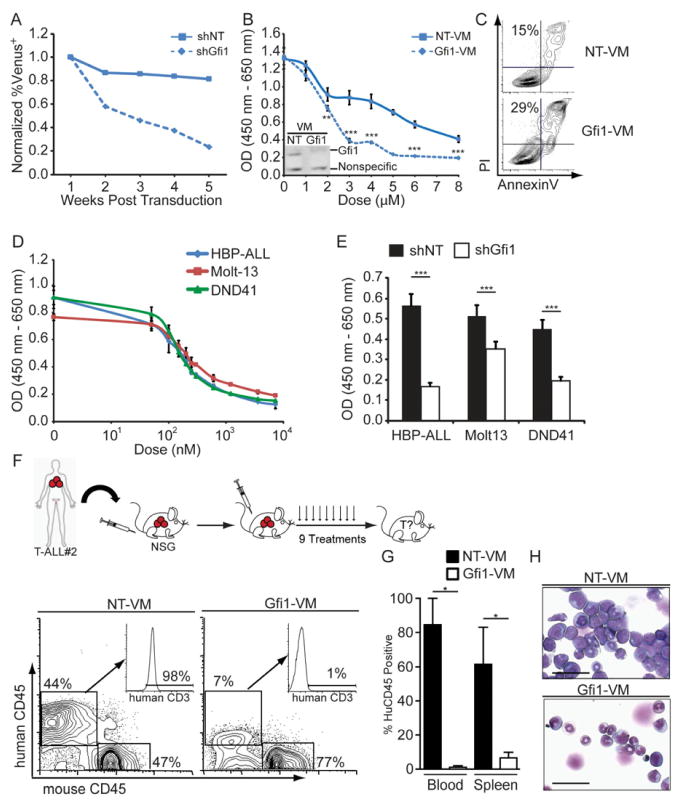
Most patients with acute lymphoblastic leukemia (ALL) fail current treatments highlighting the need for better therapies. Because oncogenic signaling activates a p53-dependent DNA damage response and apoptosis, leukemic cells must devise appropriate countermeasures. We show here that growth factor independence 1 (Gfi1) can serve such a function because Gfi1 ablation exacerbates p53 responses and lowers the threshold for p53-induced cell death. Specifically, Gfi1 restricts p53 activity and expression of proapoptotic p53 targets such as Bax, Noxa (Pmaip1), and Puma (Bbc3). Subsequently, Gfi1 ablation cures mice from leukemia and limits the expansion of primary human T-ALL xenografts in mice. This suggests that targeting Gfi1 could improve the prognosis of patients with T-ALL or other lymphoid leukemias.


Figures

Figure 1
Figure 1. Gfi1 associates with NOTCH1 in human T-ALL and deletion delays the development of disease
(A) Heatmap of expression of published Notch1 target genes used to classify gene expression array data from 55 T-ALL patients (GSE8879) into two groups: “Negative Notch Signature” (left) and “Positive Notch Signature” (right). ETP-ALL diagnosis is designated by an “X”. (B) Quantification of relative expression of NOTCH1, GFI1 and Notch1 target genes HES1, MYC, NOTCH3, CR2, IGF1R, and E2F5 in 55 T-ALL patients with either a “Negative Notch Signature” (gray) or a “Positive Notch Signature” (black). (C) Top: RosaCreERT2;Gfi1f/f bone marrow cells were transduced with vectors expressing ICN and then transplanted. Mice were given vehicle or tamoxifen to induce Cre activity. Bottom: Kaplan-Meier curve. (D) PCR genotype analysis of the Gfi1 locus in control tissues (Gfi1Δ/Δ, Gfi1+/Δ, Gfi1+/+) and in representative tumors from mice either treated with vehicle or OHT. FLOX, Gfi1f allele; +, the wild type allele, Δ, deleted allele. (E, F) Spleen weights (E, n=6 each group) and flow cytometric analysis of thymic tumors (F, top panels) and spleen sections stained with H&E (F, bottom panels) collected during post-mortems from indicated transplant groups. Scale bars represent 50 μm. (G) Top: Notch1ΔCT;Gfi1+/+ and Notch1ΔCT;Gfi1−/− mice were monitored for tumor development and survival. Bottom: Kaplan-Meier curve. (H, I) Spleen weights (H) and flow cytometric analysis (I, top panels) and histological sections (I, bottom panels) of Notch1ΔCT;Gfi1+/+ (n=7) and Notch1ΔCT; Gfi1−/− (n=3) tumors. (J) Top: Gfi1+/+ and Gfi1−/− newborn mice were injected with MMLV. Bottom: Kaplan-Meier curve. (K) Thymic tumor cell numbers of Notch1ΔCT induced tumors. (L) Flow cytometric analysis (top panels) and histological section (bottom panels) of MMLV-induced Gfi1+/+ versus Gfi1−/− tumors. All scale bars represent 50 μm. | in all Kaplan-Meier curve plots indicate censored mice. Mean and ±SEM are shown unless stated otherwise. * p<0.05, **p<0.01, ***p<0.001. See also Figure S1 and Table S1.
Figure 2
Figure 2. Gfi1 is required for T-cell leukemia maintenance
(A) Top: Gfi1f/f or Mx1-Cre+;Gfi1f/f mice were treated with ENU and subsequently with pIpC. Bottom: Kaplan-Meier curve. Insert: PCR analysis of the Gfi1 locus in control tissues and in representative tumors (T) for Gfi1 flox and excised (Δ) alleles. (B) Top: Gfi1f/f or Mx1-Cre+;Gfi1f/f mice were treated with ENU and followed for tumors by ultrasound (US). Next, mice were treated with pIpC and tumor development was determined by ultrasound. Bottom: Representative ultrasound images; scale bar = 20 mm (C) Change of thymic surface area before and after treatment with pIpC for mice (see B). (D) Top: Notch1ΔCT;Gfi1f/f or Notch1ΔCT;Mx1-Cre+;Gfi1f/f mice were treated with ENU and subsequently monitored by ultrasound for tumor (T) development. Upon appearance of a mass, mice were injected with pIpC and followed for tumor progression or regression by ultrasound. Bottom: Kaplan-Meier curve. Insert: PCR analysis of allele excision (Δ). (E) Representative ultrasound images of tumors before and after pIpC injection; scale bar =20 mm. (F) Change of thymic surface area before and after treatment with pIpC (see E). (G) Top: Gfi1f/f tumors or tumors that had one Gfi1 allele deleted (Mx1-Cre+;Gfi1f) were transplanted into CD45.1 recipient mice, which were then treated with pIpC. Bottom: Kaplan-Meier curve. (H) T-ALL cell lines 5151, 5046 and 5010 were transduced with retrovirus vectors expressing Gfi1N382S and DsRed or DsRed alone. DsRed was measured over time by FACS and normalized to the level at 48 hours. 1 of 3 representative experiments is shown. (I) Top: Gfi1f/f or Mx1-Cre+;Gfi1f/f mice were injected with ENU. 50 days later they were treated with pIpC. 28 days later they were irradiated, and transplanted with wild-type CD45.1 bone marrow cells, then followed for survival. Bottom: Kaplan-Meier curve. One Gfi1f/f mice was sacrificed for morbidity unrelated to leukemia. (J) Bone marrow of mice in (I) at the end of observation were examined for contribution of the CD45.2 (host bone marrow) and CD45.1 (donor bone marrow). | in all Kaplan-Meier curve plots indicate censored mice. Mean and ±SEM are shown unless stated otherwise. * p<0.05, ** p<0.01. See also Figure S2.
Figure 3
Figure 3. Gfi1 is required for maintenance of B-cell lymphoma
(A) Top: Gfi1+/+;Eμ-Myc andGfi1−/−;Eμ-Myc mice were monitored for tumor development and survival. Bottom: Kaplan-Meier curve. (B) Flow cytometric analysis (top) and histological sections (bottom) of Eμ-Myc-induced Gfi1+/+ and Gfi1−/− tumors. Scale bars represent 50 μm. (C) Top: Mx1-Cre+;Gfi1f/f;Eμ-Myc and Gfi1f/f;Eμ-Myc were observed by ultrasound for appearance of B-cell lymphoma. Upon appearance of a mass, mice were injected with pIpC and monitored for tumor progression and survival. Bottom: Kaplan-Meier curve. (D) Representative ultrasound images of tumors before and after pIpC injection. Scale bar = 20 mm. (E) Change of tumor surface area (left) before and after treatment with pIpC for mice with the indicated genotypes as well as cellularity of mediastinal tumor after treatment (right). (F) Top: Gfi1+/+;Eμ-Myc and Gfi1−/−;Eμ-Myc animals were observed until enlarged lymph nodes evidenced tumor development, then irradiated and transplanted with CD45.1 bone marrow cells and monitored for survival. Bottom: Kaplan-Meier curve. | in all Kaplan-Meier curve plots indicate censored mice. Mean and ±SEM are shown unless stated otherwise. *p<0.05. See also Figure S3.
Figure 4
Figure 4. Gfi1 mediates DNA damage and p53 signaling to control apoptosis
(A) Unsupervised hierarchical clustering of the averaged normalized Log2 gene expression values from ENU (n=3) or ENU/Notch1ΔCT (n=2) induced T-ALL arising in Gfi1f/f (WT) or Mx1-Cre+;Gfi1f/f (KO) pIpC treated mice (ENU WT n=3, ENU KO n=3, ENU/Notch1ΔCT WT n=2, ENU/Notch1ΔCT KO n=2). (B) GSEA butterfly plots for pathways related to DNA damage, p53 signaling or apoptosis found in both ENU and Notch1ΔCT initiated tumor signatures from (A). (C) Classification of genes in the leading edge of the GSEA Apoptosis signature in (B) as proapoptotic, antiapoptotic or context dependent. (D–E) Determination of γH2AX levels in normal tissue as well as in B and T-cell leukemia by FACS (D) and immunofluorescence (E). One experiment was performed. Scale bars = 50 μm. (F) Level of spontaneous apoptosis in the indicated tissues and tumors before and after Gfi1 deletion. T-ALL: Gfi1+/+, n=4; Gfi1f/f, n=17; Gfi1Δ/Δ, n=5. B-ALL: Gfi1+/+, n=4; Gfi1f/f n=13; Gfi1Δ/Δ, n=4. (G) Gfi1+/+ (n=7), Gfi1−/− and Gfi1f/Δ(one constitutive Gfi1 KO tumor and two tumors, in which Gfi1 has been deleted with more than 50 % excision, n=3,) thymic tumor cells and Gfi1+/+;Eμ-Myc+ (n=7) and Gfi1−/−;Eμ-Myc+ (n= 3) lymphomas were explanted and irradiated (6 Gy), and examined for AnnexinV staining by FACS. (H) T-ALL cell lines 5151, 5046, and 5010 were transduced with retrovirus vectors MSCV-Bcl-2, expanded and then transduced with vectors encoding Gfi1N382S and DsRed or DsRed alone. DsRed was measured over time by FACS and normalized to the level at 48 hours. One of 3 representative experiments is shown. Mean and ±SEM are shown unless stated otherwise. *p<0.05, **p<0.01. See also Table S2.
Figure 5
Figure 5. Gfi1 restricts p53 dependent induction of apoptosis
(A) Unsupervised hierarchical clustering of the averaged normalized Log2 gene expression values from Gfi1+/+ (WT) and Gfi1−/− (KO) thymocytes with or without irradiation (Gfi1+/+ control n=2, Gfi1−/− control n=2, Gfi1+/+ irradiated n=3, Gfi1−/− irradiated n=3). (B) GSEA butterfly plots for pathways related to DNA damage, p53 signaling or apoptosis enriched in Gfi1 deficient tumors (Figure 4B) that emerge in Gfi1−/− T cells only after irradiation. (C) Expression of Bax, Pmaip1 (Noxa) and Bbc3 (Puma) in Gfi1+/+ and Gfi1−/− thymocytes before and after irradiation. One representative experiment out of at least two experiments is shown. The numbers above the bars represent the mean values of the measurements. (D) Peaks across the Bax, Pmaip1 and Bbc3 loci from Gfi1 ChIP-Seq of murine hematopoietic progenitor cells immortalized by retroviral transduction of an MLL-ENL expression vector. (E) ChIP of p53 using primers from Gfi1-bound regions (underscored with arrow in (D)) of Bax, Pmaip1, and Bbc3 before and after irradiation. Represented are the mean and standard deviation of the fold difference compared to IgG control from one experiment with three technical repeats. (F) Log2 values of the fold change of the irradiated vs. unirradiated gene expression values of all genes (left) or 1.5-fold differentially regulated (right) between Gfi1+/+ and Gfi1−/− thymocytes. Gfi1-bound (identified in (D)) p53 target genes are shown in red. (G) Percentage of live Gfi1+/+;Trp53+/+, Gfi1−/−;Trp53+/+, Gfi1+/+;Trp53−/−, and Gfi1−/−;Trp53−/− thymocytes after ex vivo γ-irradiation (left, n=3). Percentage of live Gfi1+/+, Gfi1−/−, Gfi1+/+;Vav-Bcl2, and Gfi1−/−;Vav-Bcl2 thymocytes after ex vivo γ-irradiation (right, n=3). (H) Immunoblot of total cell lysate (left) and immunoprecipitation (right) were performed using p53, phospho- p53 or Gfi1 antibodies on lysates from untreated or irradiated 293T cells transfected as indicated with FLAG-tagged Gfi1 constructs. One representative experiment from at least two experiments is shown. (I) Immunoblot of total cell lysate (left) and immunoprecipitation using either Gfi1 or an isotype control (actin) antibody (right) were performed using phospho-p53 (Ser15) antibody on lysates from irradiated thymocytes cells. One representative experiment from at least two experiments is shown. (J) Reporter expression assay using the Bax promoter and various amounts (μg) of transfected vectors encoding p53 or Gfi1. (K) Thymocytes from the indicated mice were irradiated or left untreated. After 30 minutes, total cell lysates were immunoprecipitated with an anti-mono-methyl K372 p53 antibody, then immunoblotted with an anti-p53 antibody. p53 and tubulin in total cell lysates are also shown. One experiment out of at least two experiments is shown. (L) Thymocytes nuclear extracts from the indicated mouse strains were immunoprecipitated with an anti-mono-methyl K372 p53 antibody, then immunoblotted with an anti-p53 antibody. Input control shows the level of Gfi1 in thymocytes from Gfi1+/+, Gfi1−/− and Gfi1P2A/P2A mice and the loading control LaminB. One experiment out of at least two experiments is shown. (M) Schematic representation showing methylated p53 binds to DNA and robustly activates the expression of target genes (a) and Gfi1 co-occupancy of a subset of p53 targets tethers a Gfi1 SNAG-dependent cofactor, which demethylates p53 to dampen the expression of p53 target gene (b). Mean and ±SEM are shown unless stated otherwise. *p<0.05, **p<0.01. See also Figure S4.
Figure 6
Figure 6. Gfi1 as a target to treat human leukemia
(A) HBP-ALL cells were transduced with Venus-marked shRNA expressing lentiviral vectors targeting Gfi1 (shGfi1, dotted line) or non-targeting control (shNT, solid line). Expression of Venus was measured by FACS 72 hours post transduction, which was set as 1, and subsequent measurements were taken by FACS over a 5 week period and normalized to the first reading, p=0.058. (B) Growth of HBP-ALL cells treated with Gfi1 or NT Vivo-Morpholinos (VM) as measured by WST assay for 48 hours. Inset: Immunoblot for Gfi1 in HBP-ALL cells treated with NT or Gfi1-VM (4 μM) for 16 hours. (C) AnnexinV and PI staining of HBP-ALL cells after 16 hours of Gfi1 or NT VM treatment (4μM). (D) Growth of T-ALL cell lines treated with indicated doses of the Obatoclax as measured by WST assay for 48 hours. (E) Gfi1 knockdown was combined with Obatoclax treatment (200 nM) and growth was measured by WST assay for 48 hours. 1 representative experiment is shown; experiments were repeated 2–3 times (A–E). (F) Top: Primary patient T-ALL samples were transplanted in NSG mice and then mice were injected with Gfi1 or NT VM 3 times per week for 3 weeks. Bottom: FACS analysis of human CD45 and human CD3 of NT (n=2) or Gfi1-treated (n=3) mice. (G) Quantification of total human CD45+ cells in the blood and spleen from mice in (F). (H) Cytospins of the BM from mice in (F). Scale bars = 50 μm. Mean and ±SEM are shown unless stated otherwise. *p<0.05, **p<0.01, ***p<0.001. See also Figure S5.

References

    1. Adams JM, Harris AW, Pinkert CA, Corcoran LM, Alexander WS, Cory S, Palmiter RD, Brinster RL. The c-myc oncogene driven by immunoglobulin enhancers induces lymphoid malignancy in transgenic mice. Nature. 1985;318:533–538. - PubMed
    1. Bartek J, Bartkova J, Lukas J. DNA damage signalling guards against activated oncogenes and tumour progression. Oncogene. 2007;26:7773–7779. - PubMed
    1. Bartkova J, Horejsi Z, Sehested M, Nesland JM, Rajpert-De Meyts E, Skakkebaek NE, Stucki M, Jackson S, Lukas J, Bartek J. DNA damage response mediators MDC1 and 53BP1: constitutive activation and aberrant loss in breast and lung cancer, but not in testicular germ cell tumours. Oncogene. 2007;26:7414–7422. - PubMed
    1. Blyth K, Terry A, Mackay N, Vaillant F, Bell M, Cameron ER, Neil JC, Stewart M. Runx2: a novel oncogenic effector revealed by in vivo complementation and retroviral tagging. Oncogene. 2001;20:295–302. - PubMed
    1. Chakraborty J, Okonta H, Bagalb H, Lee SJ, Fink B, Changanamkandat R, Duggan J. Retroviral gene insertion in breast milk mediated lymphomagenesis. Virology. 2008;377:100–109. - PubMed

Publication types

MeSH terms

Associated data