. 2013 Feb 1;4(2):260-70.
doi: 10.1364/BOE.4.000260. Epub 2013 Jan 17.

High-resolution, lensless endoscope based on digital scanning through a multimode optical fiber

Affiliations

High-resolution, lensless endoscope based on digital scanning through a multimode optical fiber

Ioannis N Papadopoulos et al. Biomed Opt Express. .

Abstract

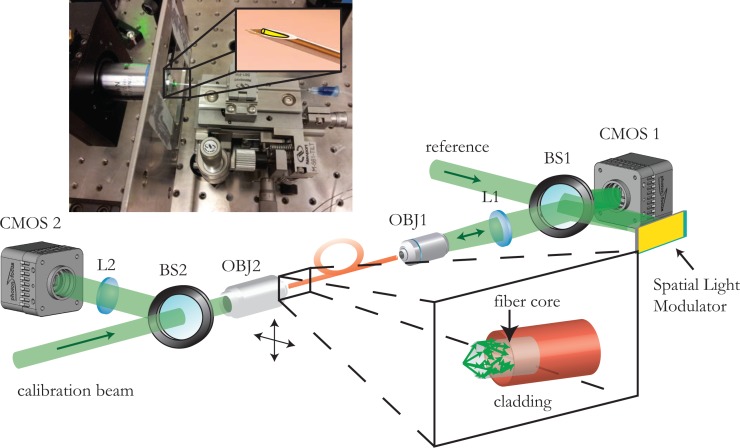
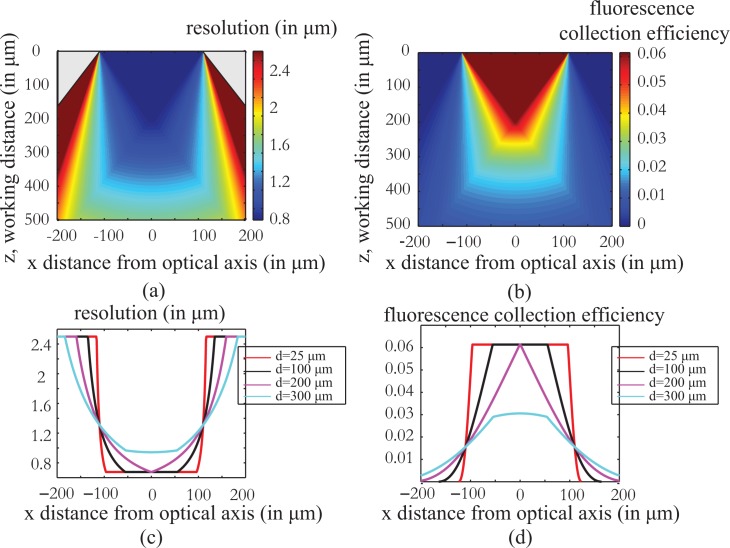
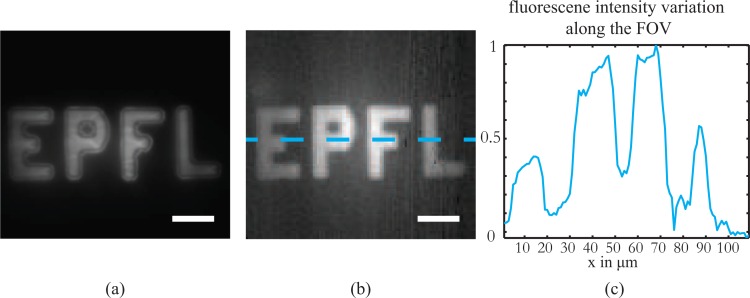
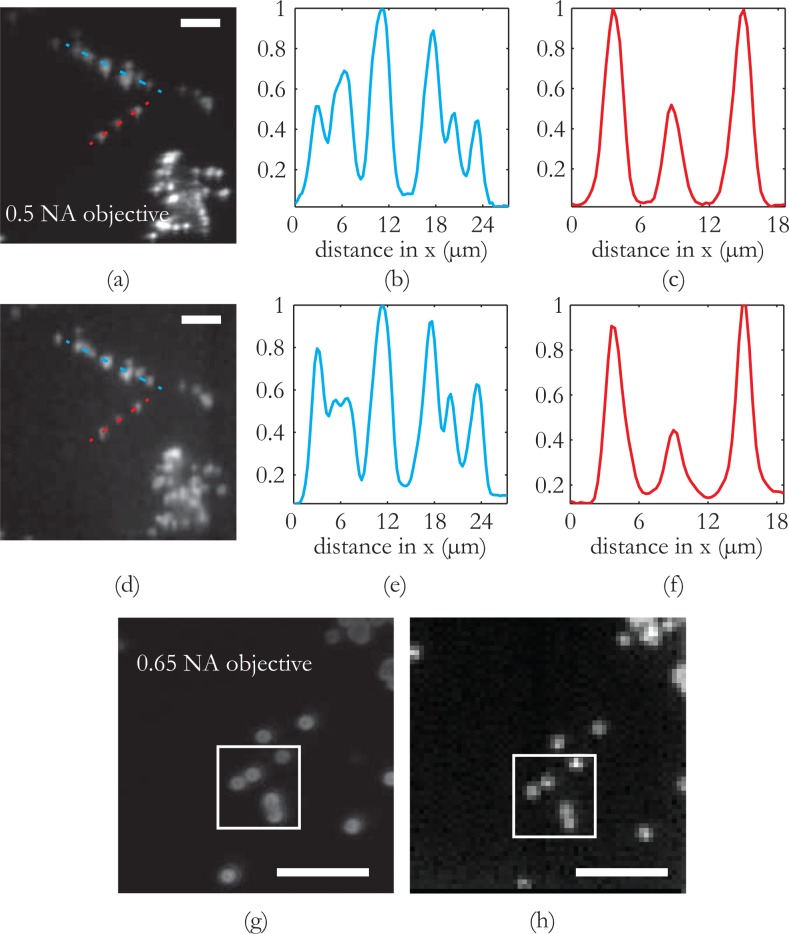
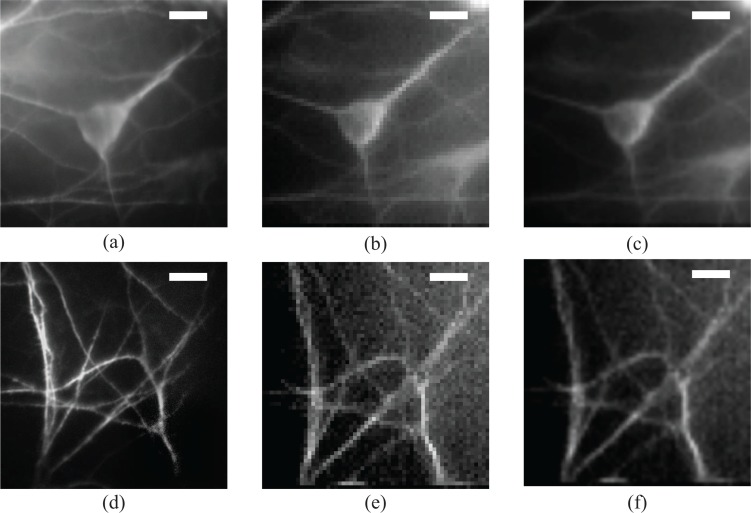
We propose and experimentally demonstrate an ultra-thin rigid endoscope (450 μm diameter) based on a passive multimode optical fiber. We use digital phase conjugation to overcome the modal scrambling of the fiber to tightly focus and scan the laser light at its distal end. By exploiting the maximum number of modes available, sub-micron resolution, high quality fluorescence images of neuronal cells were acquired. The imaging system is evaluated in terms of fluorescence collection efficiency, resolution and field of view. The small diameter of the proposed endoscope, along with its high quality images offer an opportunity for minimally invasive medical endoscopic imaging and diagnosis based on cellular phenotype via direct tissue penetration.

Keywords: (070.5040) Phase conjugation; (090.1995) Digital holography; (110.2350) Fiber optics imaging; (170.0110) Imaging systems; (170.2150) Endoscopic imaging; (170.7050) Turbid media.


Figures

Fig. 1
Fig. 1
Experimental setup and picture of the needle endoscope. On the lower part, the experimental setup is presented. Light focused on the fiber tip is dispersed over the different propagation modes supported by the fiber (inset). The speckled output is combined with the reference and the resulting interference pattern is digitally recorded onto the CMOS sensor. The reconstructed phase of the hologram is assigned on the Spatial Light Modulator, which then modulates the reference beam. The phase conjugate beam that is generated propagates backwards, retracing its way through the multimode fiber and coming into focus at the original position. The calibration beam can be scanned in both lateral dimensions (moving the calibration objective using motorized stages) generating a regular grid of focused spots and the corresponding phase lookup table. Upper part. Placing the fiber inside a needle tip we can make a rigid ultrathin endoscope that will allow the fiber to remain intact and at the same time allow for minimally invasive endoscopic imaging. The outer diameter of the endoscope is limited only by the needle and can be as small as 460μm for the 250μm cladding fiber used in the experiments.
Fig. 2
Fig. 2
Resolution and fluorescence collection efficiency of the fiber endoscope as a function of working distance z and the distance from the optical axis of the system x as calculated using a geometrical optics analysis (Appendix A). The calculations are done for a 220μm diameter, 0.53 NA fiber. As shown in Fig. 2(a) and (c), the resolving power of the imaging system becomes worse as the imaging plane is set away from the fiber tip while at the same time, the useful field of view increases. indicate a clear trade off between resolution and field of view. Fig 2 (b), (d) present the fluorescence collection efficiency of the imaging system as a function of position. The efficiency is worse as the fluorophore is placed away from the fiber facet and towards the edges of the field of view. The simulations can help us predict the behavior of the system and correct any differences in the fluorescent levels of the final image.
Fig. 3
Fig. 3
Fiber endoscope large field of view imaging. The scanning fluorescence image captured from a large field of view with the fiber endoscope at a working distance of 200m is a high fidelity replica of the widefield image taken with a microscope objective. The difference in the fluorescence level between the center and the edges is attributed to the different collections efficiencies away from the optical axis of the fiber and the quasi linear dependence observed coincides with the predicted behavior for the specific working distance (see Fig. 2(d)). The endoscope is capable of providing high information capacity, large field of view images. Scale bar equal to 20μm.
Fig. 4
Fig. 4
Comparison of the fiber endoscopic imaging modality vs a conventional optical system of the same numerical aperture and estimation of resolution limit. (a) Widefield 0.5NA microscope objective image and (d) Image acquired with the multimode fiber. Comparison of the imaging capability of the system against a conventional optical system of similar NA. The information conveyed by the lensless multimode fiber endoscope is directly comparable to that given by the 0.5 NA microscope objective. The comparison of the cross sectional plots (b),(e) and (c),(f) verifies the conclusion. Fig. 3(g) and (h) are used to estimate the resolution of the system. In Fig. 3(g) the bead sample is imaged with a 0.65 NA objective to get a more detailed view. The scanning scheme (with a pixel pitch of 0.5μm) gives an image where two beads almost fused into each other can be still be separated, therefore placing the resolution limit of the system in the submicron range. Scale bars in all images are 10μm.
Fig. 5
Fig. 5
Probing cellular and subcellular details with the multimode fiber endoscope. Images of fluorescently stained neuronal cells acquired with the multimode fiber endoscope and compared against conventional images acquired with a microscope objective. First column, (a) widefield fluorescent image of a single neuron soma and (d) detail of dendrites, middle row; (b) and (e) direct stitched image as acquired from the fiber and right row, image from the fiber resampled and filtered so that the pixelation induced by the scanning acquisition is overcome. Highly detailed images of the neuronal soma and the dendritic network can be resolved by the fiber imaging system. The high quality of the images can make this endoscope useful for diagnostic purposes based on cellular phenotype. The working distance is 200μm to compensate for the coverslip that separates the cells from the fiber facet. Field of view is 60μm by 60μm and scale bars in all images are 10μm.
Fig. 6
Fig. 6
Geometrical optics calculations of the beam diameter as a function of the distance x from the optical axis and the working distance z.

References

    1. Flusberg B., Cocker E., Piyawattanametha W., Jung J., Cheung E., Schnitzer M., “Fiber-optic fluorescence imaging,” Nat. Methods 2, 941–950 (2005).10.1038/nmeth820 - DOI - PMC - PubMed
    1. Helmchen F., “Miniaturization of fluorescence microscopes using fibre optics,” Exp. Physiol. 87, 737–745 (2002).10.1113/eph8702478 - DOI - PubMed
    1. Jung J., Schnitzer M., “Multiphoton endoscopy,” Opt. Lett. 28, 902–904 (2003).10.1364/OL.28.000902 - DOI - PubMed
    1. Jung J., Mehta A., Aksay E., Stepnoski R., Schnitzer M., “In vivo mammalian brain imaging using one-and two-photon fluorescence microendoscopy,” J. Neurophysiol. 92, 3121–3133 (2004).10.1152/jn.00234.2004 - DOI - PMC - PubMed
    1. Levene M. J., Dombeck D., Kasischke K., Molloy R., Webb W., “In vivo multiphoton microscopy of deep brain tissue,” J. Neurophysiol. 91, 1908–1912 (2004).10.1152/jn.01007.2003 - DOI - PubMed