. 2013 Apr 26;340(6131):491-5.
doi: 10.1126/science.1234273. Epub 2013 Feb 14.

Simultaneous femtosecond X-ray spectroscopy and diffraction of photosystem II at room temperature

Affiliations

Simultaneous femtosecond X-ray spectroscopy and diffraction of photosystem II at room temperature

Jan Kern et al. Science. .

Abstract

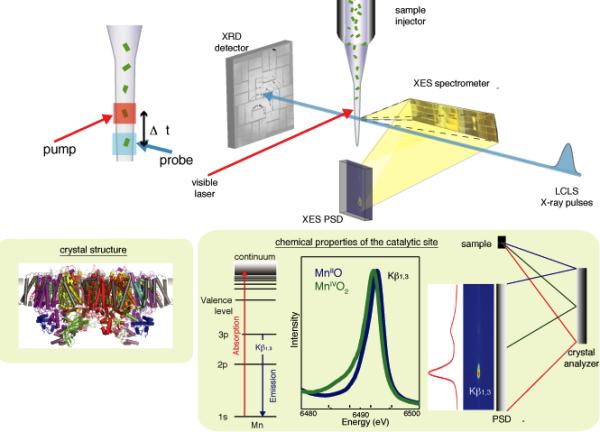
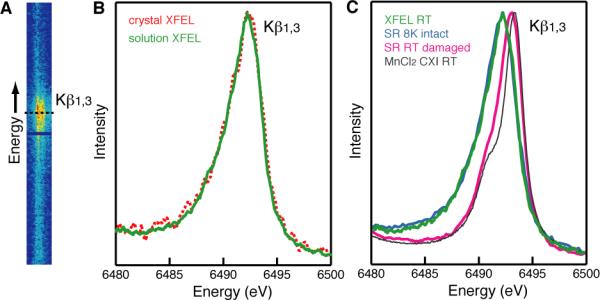
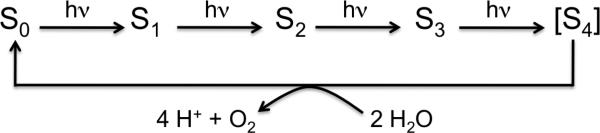
Intense femtosecond x-ray pulses produced at the Linac Coherent Light Source (LCLS) were used for simultaneous x-ray diffraction (XRD) and x-ray emission spectroscopy (XES) of microcrystals of photosystem II (PS II) at room temperature. This method probes the overall protein structure and the electronic structure of the Mn4CaO5 cluster in the oxygen-evolving complex of PS II. XRD data are presented from both the dark state (S1) and the first illuminated state (S2) of PS II. Our simultaneous XRD-XES study shows that the PS II crystals are intact during our measurements at the LCLS, not only with respect to the structure of PS II, but also with regard to the electronic structure of the highly radiation-sensitive Mn4CaO5 cluster, opening new directions for future dynamics studies.


Figures

Fig. 1
Fig. 1
Setup of simultaneous X-ray spectroscopy and crystallography experiment at the CXI instrument of LCLS. The crystal suspension is electric-field focused into a microjet that intersects the X-ray pulses. XRD data from a single crystal are collected downstream with a CSPAD detector and XES data from the same crystal are collected at ~90° to the beam via a multi-crystal XES spectrometer and a compact position sensitive detector (PSD). A Nd-YLF laser (527 nm) is used to illuminate the crystals. The timing protocol (inset, left) consists of a fixed time of flight Δt between optical pump and X-ray probe. The schematic of the energy dispersive spectrometer, MnII and MnIV oxide Kβ1,3 spectra, and energy level diagram for XES are shown (inset, bottom right).
Fig. 2
Fig. 2
Structure deduced from diffraction of micron-sized crystals of PS II using sub 50 fs X-ray pulses at room temperature at LCLS. (A) 2mFo-DFc electron density map for the PS II complex in the dark S1 state obtained at LCLS; one monomer of the protein is shown in yellow and the electron density is contoured at 1.2 σ (blue mesh) shown for a radius of 5 Å around the protein. (B) Detail of the same map in the area of the Mn4CaO5 cluster in the dark S1 state, with mesh contoured at 1.0 σ grey) and 4.0 σ (blue). Selected residues from subunit D1 are labeled for orientation; Mn is shown as violet spheres, and Ca as an orange sphere (metal positions taken from pdb file 3bz1).
Fig. 3
Fig. 3
Femtosecond XES of PS II. (A) The 2D Kβ1,3 X-ray emission spectra from microcrystals of PS II collected with a position sensitive detector at the CXI instrument using sub 50 fs pulses of about 2-3×10¹¹ photons/(pulse μm2). (B) X-ray emission spectra of a solution of PS II (green) and single crystals of PS II (red dashed) in the dark state, both collected at the CXI instrument, obtained from the 2D plot in panel (A) by integration along the horizontal axis. (C) X-ray emission spectra of PS II solutions in the dark state collected at the CXI instrument at RT (green) or collected using SR under cryogenic conditions with low dose (“8K intact”, light blue) and using SR at RT under photo-reducing conditions (“RT damaged”, pink). The spectrum from MnIICl2 in aqueous solution collected at RT at the CXI instrument is shown (grey) for comparison.
Fig. 4
Fig. 4
Characterization of the illuminated PS II sample. (A) On-line MIMS measurements of light-induced O2 yield detected as mixed labeled 16O18O species after illumination of photosystem II from T. elongatus. The data shows that >73% of the sample occupies the S2 state after one illumination. (B) XFEL XES of PS II in the S2 state. The Kβ1,3 XES data collected from 362 micro crystals of PS II in the first illuminated S2 state are shown in blue (*). The XFEL spectrum of microcrystals of PS II in the dark stable S1 state is shown as a green line. For comparison an X-ray emission spectrum of completely photo-reduced (“damaged”) PS II collected at RT at a synchrotron is shown in pink. (C) Isomorphous difference map between the XFEL-illuminated (S2 state) and the XFEL-dark (S1 state) XRD dataset in the region of the Mn4CaO5 cluster, with Fo-Fo difference contours shown at +3 σ (green) and –3 σ (red); histogram analysis indicates that this map is statistically featureless (Fig. S6). Metal ions of the Mn4CaO5 cluster are shown for orientation as violet (Mn) and orange (Ca) spheres, subunits are indicated in yellow (D1), orange (D2), pink (CP43) and green (PsbO).
Scheme 1
Scheme 1
Reaction cycle of water oxidation at the Mn4CaO5 cluster in PS II.

Comment in

References

    1. Renger G. In: Photosynthesis: Plastid Biology, Energy conversion and Carbon Assimilation. Eaton-Rye JJ, Tripathy BC, Sharkey TD, editors. Springer; Dordrecht: 2012. pp. 359–414.
    1. Kanady JS, Tsui EY, Day MW, Agapie T. Science. 2011;333:733. - PubMed
    1. Mukherjee S, et al. Proc. Natl. Acad. Sci. U. S. A. 2012;109:2257. - PMC - PubMed
    1. Zouni A, et al. Nature. 2001;409:739. - PubMed
    1. Ferreira KN, Iverson TM, Maghlaoui K, Barber J, Iwata S. Science. 2004;303:1831. - PubMed

Publication types