. 2013 Feb 15:14:104.
doi: 10.1186/1471-2164-14-104.

A highly expressed miR-101 isomiR is a functional silencing small RNA

Affiliations

A highly expressed miR-101 isomiR is a functional silencing small RNA

Franc Llorens et al. BMC Genomics. .

Abstract

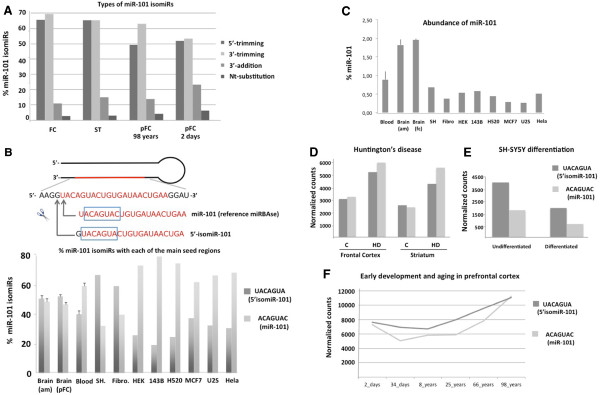
Background: MicroRNAs (miRNAs) are short non-coding regulatory RNAs that control gene expression usually producing translational repression and gene silencing. High-throughput sequencing technologies have revealed heterogeneity at length and sequence level for the majority of mature miRNAs (IsomiRs). Most isomiRs can be explained by variability in either Dicer1 or Drosha cleavage during miRNA biogenesis at 5' or 3' of the miRNA (trimming variants). Although isomiRs have been described in different tissues and organisms, their functional validation as modulators of gene expression remains elusive. Here we have characterized the expression and function of a highly abundant miR-101 5'-trimming variant (5'-isomiR-101).

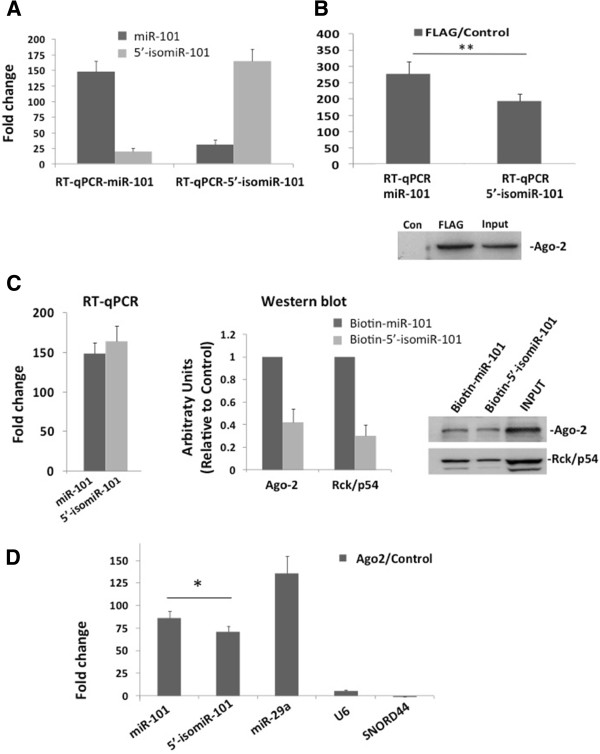
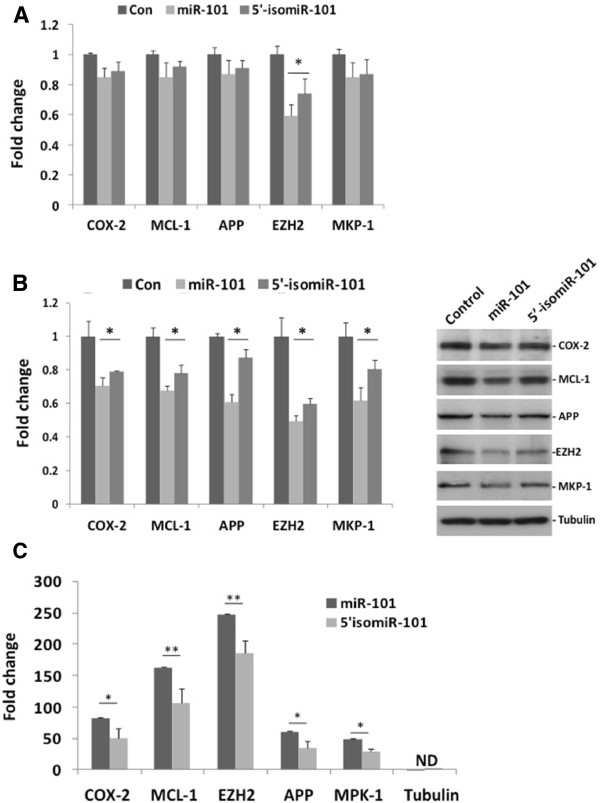
Results: The analysis of small RNA sequencing data in several human tissues and cell lines indicates that 5'-isomiR-101 is ubiquitously detected and a highly abundant, especially in the brain. 5'-isomiR-101 was found in Ago-2 immunocomplexes and complementary approaches showed that 5'-isomiR-101 interacted with different members of the silencing (RISC) complex. In addition, 5'-isomiR-101 decreased the expression of five validated miR-101 targets, suggesting that it is a functional variant. Both the binding to RISC members and the degree of silencing were less efficient for 5'-isomiR-101 compared with miR-101. For some targets, both miR-101 and 5'-isomiR-101 significantly decreased protein expression with no changes in the respective mRNA levels. Although a high number of overlapping predicted targets suggest similar targeted biological pathways, a correlation analysis of the expression profiles of miR-101 variants and predicted mRNA targets in human brains at different ages, suggest specific functions for miR-101- and 5'-isomiR-101.

Conclusions: These results suggest that isomiRs are functional variants and further indicate that for a given miRNA, the different isomiRs may contribute to the overall effect as quantitative and qualitative fine-tuners of gene expression.


Figures

Figure 1
Figure 1
miR-101 and 5’-isomiR-101 are abundant in different cells and tissues. A. Relative frequencies of different miR-101 isomiRs in the frontal cortex (FC) and striatum (ST) of a control individual [16] and prefrontal cortex (pFC, 98 years and 2 days old) [26]. The summed frequency of all sequences mapping onto miR-101 was considered as the 100%. B. Percentage of each of the two main seed regions in human brain (4 individuals) and blood (4 individuals), and human cell lines [29]. A scheme is included showing miR-101 precursor and mature forms (in red). The arrows point to the major cleavage sites producing the most abundant mature miR-101 variants. The seed regions in each variant are contained in a blue box. C. Abundance of miR-101 in human blood and brain (amygdala –am- of 4 individuals and frontal cortex –fc- of two individuals aging 25 and 66 years [26]) and in cell lines [29]. In each sample, the percentage of sequences mapping onto miR-101 is calculated with respect to the total of sequences mapping onto miRNA database. D-F. miR-101 and 5’-isomiR-101 expression in the frontal cortex and the striatum of control individuals (C) and patients with HD [16]; in undifferentiated and differentiated SH-SY5Y cells and in the frontal cortex of individuals at different ages [26]. In D, E, F normalized counts are expressed as the ratio: (frequency of sequences presenting miR-101 or 5’isomiR-101 seed regions) / (frequency of sequences mapping onto miRNAs) * 10E6. When more than a biological replica is available (B and C) data are presented as the mean ± standard deviation. SH: SH-SY5Y human neuroblastoma cell line, Fibro: Fibrocytes, HEK: human embryonic kidney 293 cells, 143B: human bone osteosarcoma 143B cell line, H520: human squamous cell carcinoma H520 cell line, MCF7: human breast cancer MCF7 cell line, U2S: human osteosarcoma U2S cell line, HeLa: human cervical cancer HeLa cell line.
Figure 2
Figure 2
miR-101 and 5’-isomiR-101 bind Ago2 and Rck/p54. A. Specificity of miR-101 and 5’-isomiR-101 detection. SH-SY5Y cells were transfected with a negative control sequence (siGLO Green) or the mIRIDIAN mimics for miR-101 (dark bars) or 5’-isomiR-101 (light bars). Specific RT-qPCRs determinations for miR-101 and 5’-isomiR-101 were performed. Results are expressed as the Fold Change ratios (miridian mimic / control siGLO). B. Expression of exogenously transfected miR-101 or 5’-isomiR-101 in Ago2 immunocomplexes. SH-SY5Y cells were transfected with Siglo Green or the mIRIDIAN mimics for miR-101 or 5’-isomiR-101. Specific RT-qPCRs were performed in Ago2-FLAG immunoprecipitates.Results are expressed as the Fold Change ratios obtained from the FLAG antibody/Control antibody immunoprecipitates. Western-blot with anti-FLAG antibody shows the presence of Ago2-FLAG in the FLAG-IP and input, and the absence of Ago2-FLAG in the control IP. C. Detection of RISC components in miR-101 or 5’-isomiR-101 pull-down. SH-SY5Y cells stably expressing Ago2-FLAG were transfected with mIRIDIAN 3’-biotin-miR-101 or 3’-biotin-5’-isomiR-101. Biotin-miRNA complexes were pulled down with streptavidin beads and subsequently assayed for western blot analysis using Ago2 and Rck/p54 antibodies. The relative amount of Ago2 and Rck/p54 in 3’-biotin-5’-isomiR-101 versus 3’-biotin-miR-101 is shown in the middle panel. miRNA-101 transfected samples were used to normalize data and were assigned a value of 1. Left panel shows similar amounts of transfected 3’-biotin-miR-101 or 3’-biotin-5’-isomiR-101 determined in total cell extracts with the corresponding specific RT-qPCR assays. D. Expression of endogenous miR-101 and 5’isomiR-101 in Ago2-immunocomplexes in the human brain. Ago2 complexes were immunoprecipitated from human frontal cortex homogenates and miR-101, 5’-isomiR-101, miR-29a, U6 SNORD44 were determined by RT-qPCR. Results are expressed as the Fold Change ratios obtained from the Ago2 vs denatured Ago2 immunoprecipitates. Three independent experiments were performed in A-D. All data are expressed as the mean± SEM. Asterisks indicate statistical significance between miR-101 and 5’-isomiR-101 data : * (p ≤ 0.05), ** (p≤0.01) using Mann–Whitney test.
Figure 3
Figure 3
miR-101 and 5’-isomiR-101 differentially regulate gene expression. A. mRNA expression of miR-101 target genes following exogenous expression of miR-101 or 5’isomiR-101. After transfection of SH-SY5Y cells with the siGLO control sequence (Con) or the mIRIDIAN mimics for miR-101 or 5’-isomiR-101 the expression of COX-2, MCL-1, APP, EZH2 and DUSP-1 (MKP-1) was determined by RT-qPCRs. A control sample was used to normalize Fold Change values in each set of experiments. This control sample was assigned a value of 1. B. Protein expression of miR-101 target genes following exogenous expression of miR-101 or 5’isomiR-101. Western blot determination of COX-2, MCL-1, APP, EZH2 and DUSP-1 (MKP-1) levels in SH-SY5Y were performed in cells transfected with a control sequence (Con) and the mIRIDIAN mimics for miR-101 or 5’-isomiR-101. A control sample was used to normalize Fold Change values in each set of experiments. This control sample was assigned a value of 1. C. Expression of miR-101 target genes cells transfected with miR-101 and 5’-isomiR-101 biotynilated isomiRs. SH-SY5Y cells were transfected with Biotin, mIRIDIAN 3’-biotin-miR-101 or 3’-biotin-5’-isomiR-101. Biotin-miRNA complexes were pulled down with streptavidin beads and the expression of COX-2, MCL-1, APP, EZH2 and DUSP-1 (MKP-1) mRNA was determined by RT-qPCRs. Results are expressed as the Fold Change ratios obtained from the biotin-tagged miR-101 and 5’-isomiR-101 transfected cells versus the biotin transfected control cells. ND: Not detectable. All data are expressed as the mean ± SEM from at least three independent experiments. Asterisks indicate statistical significance between miR-101 and 5’isomiR-101 data: ** (p≤0.01), * (p≤0.5) using the Mann–Whitney test.

References

    1. Xie X, Lu J, Kulbokas EJ, Golub TR, Mootha V, Lindblad-Toh K, Lander ES, Kellis M. Systematic discovery of regulatory motifs in human promoters and 3’ UTRs by comparison of several mammals. Nature. 2005;434(7031):338–345. doi: 10.1038/nature03441. - DOI - PMC - PubMed
    1. Krek A, Grun D, Poy MN, Wolf R, Rosenberg L, Epstein EJ, MacMenamin P, da Piedade I, Gunsalus KC, Stoffel M. Combinatorial microRNA target predictions. Nat Genet. 2005;37(5):495–500. doi: 10.1038/ng1536. - DOI - PubMed
    1. Vasudevan S, Tong Y, Steitz JA. Switching from repression to activation: microRNAs can up-regulate translation. Science. 2007;318(5858):1931–1934. doi: 10.1126/science.1149460. - DOI - PubMed
    1. Kasinski AL, Slack FJ. Epigenetics and genetics. MicroRNAs en route to the clinic: progress in validating and targeting microRNAs for cancer therapy. Nat Rev Cancer. 2011;11(12):849–864. doi: 10.1038/nrc3166. - DOI - PMC - PubMed
    1. Esteller M. Non-coding RNAs in human disease. Nat Rev Genet. 2011;12(12):861–874. doi: 10.1038/nrg3074. - DOI - PubMed

Publication types

MeSH terms