Heterogeneity and changes in preferences for dying at home: a systematic review
- PMID: 23414145
- PMCID: PMC3623898
- DOI: 10.1186/1472-684X-12-7
Heterogeneity and changes in preferences for dying at home: a systematic review
Abstract
Background: Home-based models of hospice and palliative care are promoted with the argument that most people prefer to die at home. We examined the heterogeneity in preferences for home death and explored, for the first time, changes of preference with illness progression.
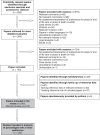
Methods: We searched for studies on adult preferences for place of care at the end of life or place of death in MEDLINE (1966-2011), EMBASE (1980-2011), psycINFO (1967-2011), CINAHL (1982-2011), six palliative care journals (2006-11) and reference lists. Standard criteria were used to grade study quality and evidence strength. Scatter plots showed the percentage preferring home death amongst patients, lay caregivers and general public, by study quality, year, weighted by sample size.
Results: 210 studies reported preferences of just over 100,000 people from 33 countries, including 34,021 patients, 19,514 caregivers and 29,926 general public members. 68% of studies with quantitative data were of low quality; only 76 provided the question used to elicit preferences. There was moderate evidence that most people prefer a home death-this was found in 75% of studies, 9/14 of those of high quality. Amongst the latter and excluding outliers, home preference estimates ranged 31% to 87% for patients (9 studies), 25% to 64% for caregivers (5 studies), 49% to 70% for the public (4 studies). 20% of 1395 patients in 10 studies (2 of high quality) changed their preference, but statistical significance was untested.
Conclusions: Controlling for methodological weaknesses, we found evidence that most people prefer to die at home. Around four fifths of patients did not change preference as their illness progressed. This supports focusing on home-based care for patients with advanced illness yet urges policy-makers to secure hospice and palliative care elsewhere for those who think differently or change their mind. Research must be clear on how preferences are elicited. There is an urgent need for studies examining change of preferences towards death.
Figures


References
-
- World Health Organization. Palliative Care for Older People: Best Practices. Copenhagen: World Health Organization; 2011.
-
- Office for National Statistics. 2010-based National Population Projections. 2011. http://www.ons.gov.uk/ons/rel/npp/national-population-projections/2010-b....
LinkOut - more resources
Full Text Sources
Other Literature Sources

