. 2013 Feb 15;3(1):3.
doi: 10.1186/2044-5040-3-3.

A human skeletal muscle interactome centered on proteins involved in muscular dystrophies: LGMD interactome

Affiliations

A human skeletal muscle interactome centered on proteins involved in muscular dystrophies: LGMD interactome

Gaëlle Blandin et al. Skelet Muscle. .

Abstract

Background: The complexity of the skeletal muscle and the identification of numerous human disease-causing mutations in its constitutive proteins make it an interesting tissue for proteomic studies aimed at understanding functional relationships of interacting proteins in both health and diseases.

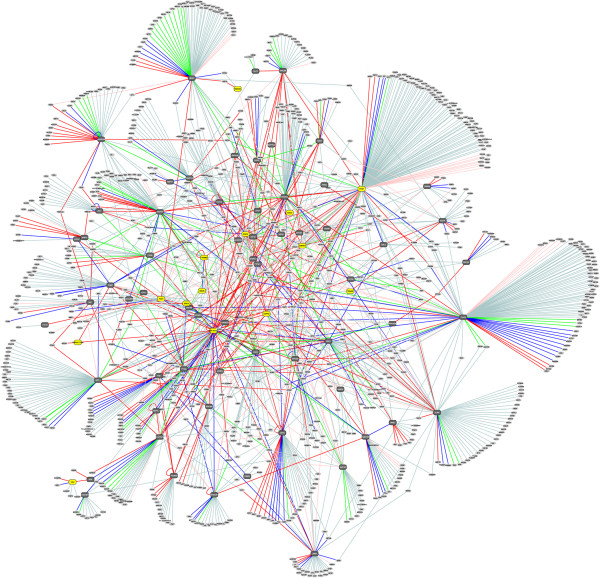
Method: We undertook a large-scale study using two-hybrid screens and a human skeletal-muscle cDNA library to establish a proteome-scale map of protein-protein interactions centered on proteins involved in limb-girdle muscular dystrophies (LGMD). LGMD is a group of more than 20 different neuromuscular disorders that principally affect the proximal pelvic and shoulder girdle muscles.

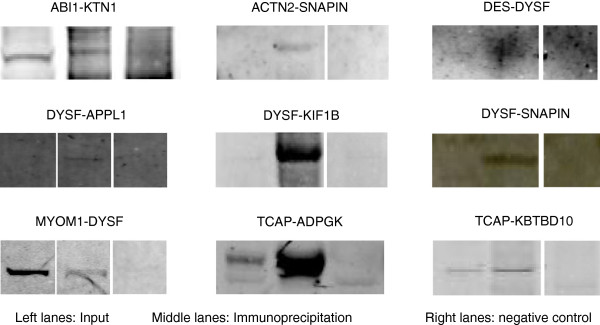
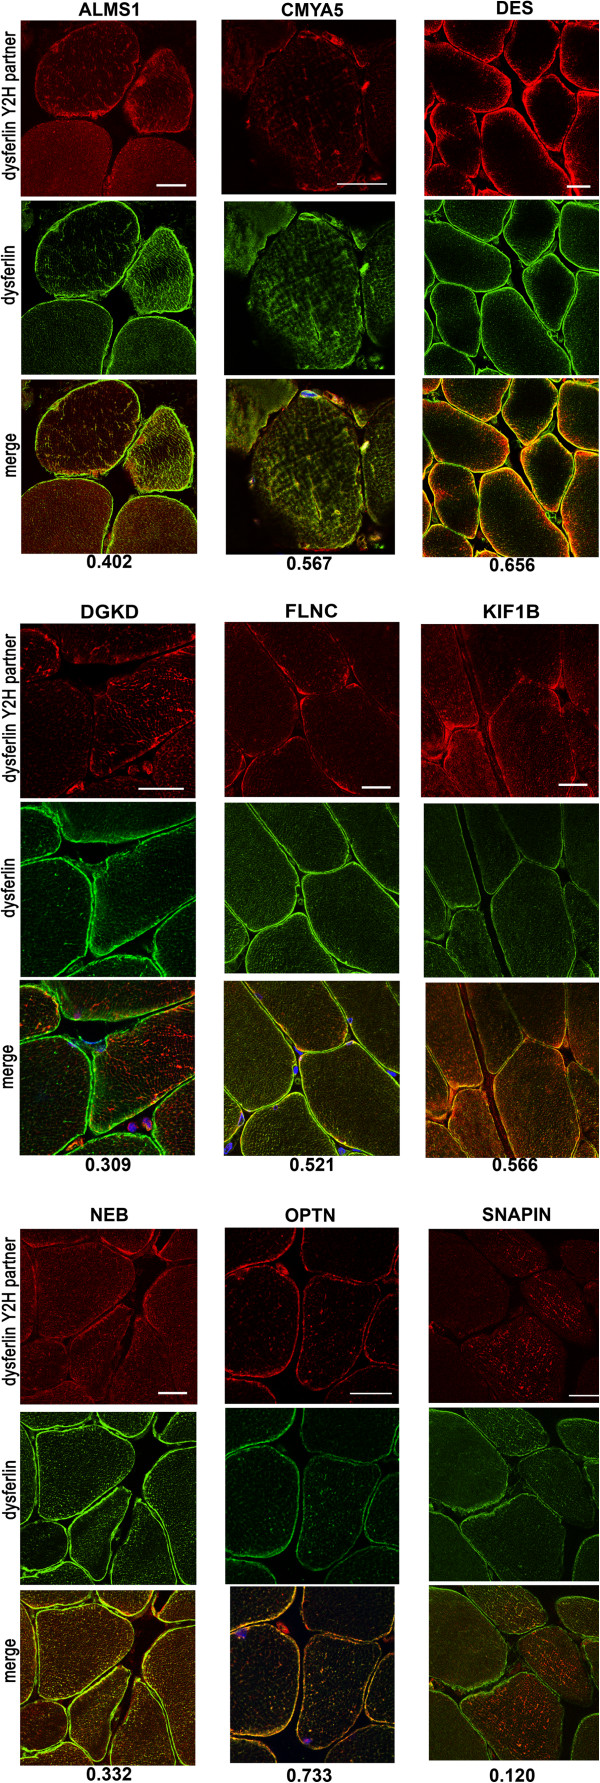
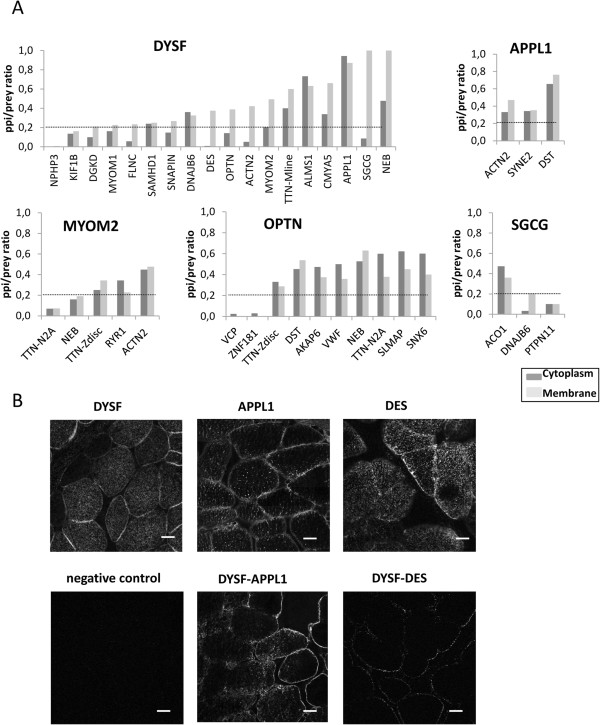
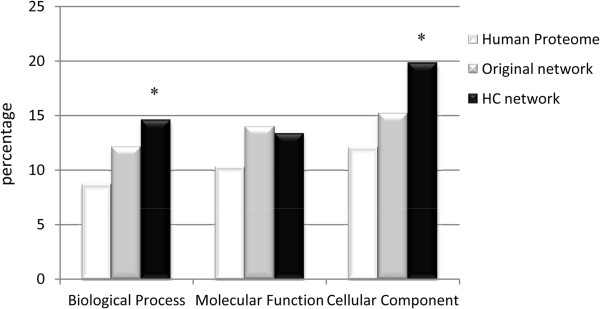
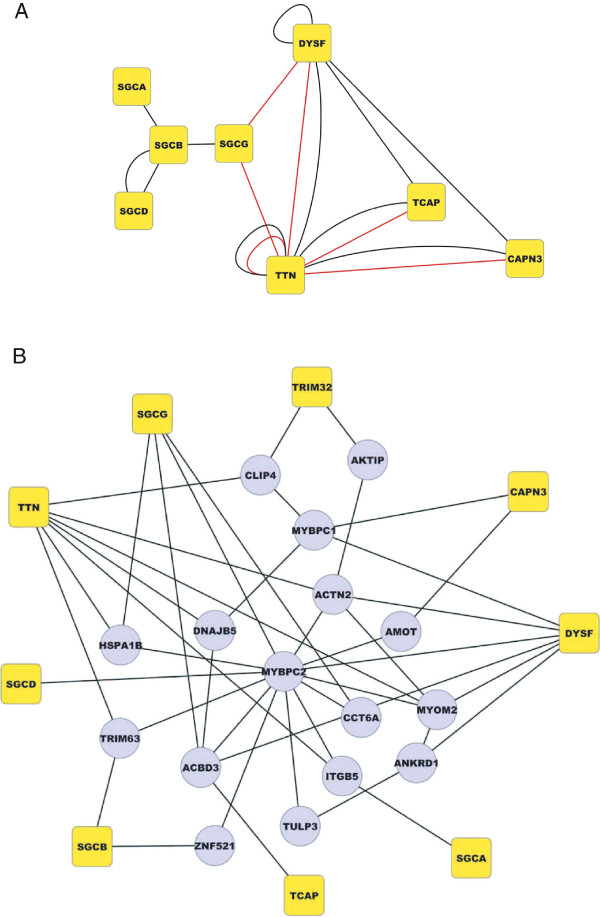
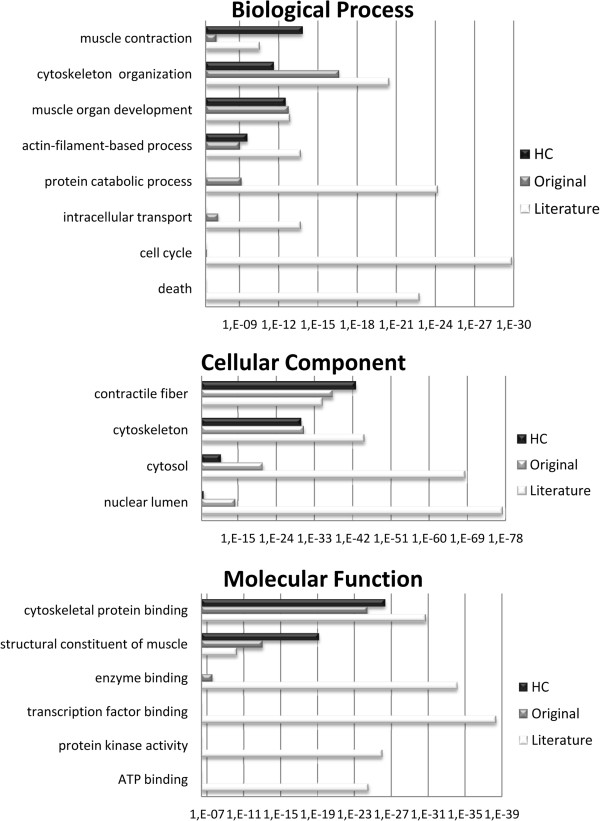
Results and conclusion: The interaction network we unraveled incorporates 1018 proteins connected by 1492 direct binary interactions and includes 1420 novel protein-protein interactions. Computational, experimental and literature-based analyses were performed to assess the overall quality of this network. Interestingly, LGMD proteins were shown to be highly interconnected, in particular indirectly through sarcomeric proteins. In-depth mining of the LGMD-centered interactome identified new candidate genes for orphan LGMDs and other neuromuscular disorders. The data also suggest the existence of functional links between LGMD2B/dysferlin and gene regulation, between LGMD2C/γ-sarcoglycan and energy control and between LGMD2G/telethonin and maintenance of genome integrity. This dataset represents a valuable resource for future functional investigations.


Figures

Figure 1
Figure 1
The LGMD-centered network. A total of 87 Y2H screens was performed starting from the LGMD proteins. Results from all individual Y2H screenings were assembled in a single network of 1492 PPIs connecting 1018 proteins. Primary baits are depicted as yellow rectangles. Secondary and tertiary baits are depicted as grey octagons. Preys are depicted as white circles. Interactions between pairs of proteins (nodes) are depicted by edges with colors according to the PBS category (PBS-A: red, PBS-B: dark blue, PBS-C: green, PBS-D: light blue, PBS-E: light pink). To visualize details on the image, readers are invited to zoom in.
Figure 2
Figure 2
Immunoprecipitation analysis of a subset of interactions. A subset of interactions from the baits: abl-interactor 1 (ABI1), DYSF, SNAP-associated protein (SNAPIN) and telethonin (TCAP) was assessed using co-immunoprecipitation using myogenic cells or in gastrocnemius mouse muscle. Immunoblotting was performed with anti-prey antibody. Left lanes= input sample. Middle lanes: Protein lysates co-immunoprecipitated with anti-bait antibody. Right lanes= negative control where the primary antibody was omitted. One PPI for ABI1, 5 for DYSF, 1 for SNAPIN and 2 for TCAP were confirmed as positive by the co-immunoprecipitation assays.
Figure 3
Figure 3
Co-localization analyses of dysferlin and its partners. Double immunostaining for DYSF (Alexa488, green) and its Y2H partners (Alexa594, red) in cross human muscle cryosections by alphabetic order. The images were taken with a 40x objective for DES, FLNC, and NEB and a 63x for OPTN, KIF1B, DGKD, SNAPIN, and CMYA5. Scale bars = 20 μm. The Pearson’s coefficient is indicated under the merge image for each PPI. As expected, DYSF showed a membrane-associated pattern and a reticular cytoplasmic pattern corresponding to T-tubules on transversal section. Depending on the tested protein, the partner pattern is variable.
Figure 4
Figure 4
Proximity ligation assays of a subset of interactions. A/ Graphs showing the ratio of the signal for the PPI divided by the signal for the prey protein alone with respect to the ROI corresponding to membrane (light grey) or cytoplasm (dark grey) for the bait proteins DYSF, APPL1, MYOM2, OPTN and SGCG. Prey proteins are named with their gene symbol. The line corresponding to 20% is indicated for each graph. For technical reasons, in the case of DYSF/SGCG and MYOM2/TTN interactions, the PPI/prey ratio is calculated as the ratio of SGCG and TTN molecules with respect to DYSF and MYOM2 although DYSF and MYOM2 were found as preys of SGCG and TTN baits. For MYOM2 and OPTN, two TTN antibodies were tested with epitopes at the Z-disc and N2A regions, respectively. Among the 44 tested interactions, 34 showed a “PPI signal” with various proportions between membrane and cytoplasm. B/ Representative confocal images of PLA results. Duolink amplifications are visualized by fluorescence (white dots). Upper panels: PLA+/- labeling of single proteins. Left panel = negative control consisting of DYSF with probes corresponding to the PPI for evaluation of background staining. Middle panel: the DYSF-APPL1 interaction signal showed a strong labeling both at the membrane and the cytoplasm. Right panel: the DYSF-DES labeling showed that the signal is mainly located at the membrane. Scale bars= 20 μm.
Figure 5
Figure 5
Fraction of proteins pairs sharing a GO annotation cluster. Each bar represents the fraction of proteins pairs that share a cluster within each of the three GO categories (biological processes, cell components or molecular functions; percentage indicated). Asterisks above the bars indicate an observed value statistically different from the one expected in the Human proteome dataset (Chi-2 test, P<0.05).
Figure 6
Figure 6
The network linking the LGMD proteins. A/ Interactions between pairs of LGMD proteins. Interactions are depicted by black lines if previously reported and in red if detected in our work for the first time. B/ Subnetwork presenting links of three nodes or shorter with LGMD proteins. LGMD2 proteins and their preys are depicted as yellow and grey nodes, respectively. Only preys that show at least two interactions with LGMD proteins are presented. The figure indicates the existence of a dense network around the group of LGMD-causing proteins.
Figure 7
Figure 7
GO enrichment analysis of the three datasets compared to the human proteome. A GO term enrichment analysis of the three datasets (LGMD-centred, HC and literature-enriched datasets) was performed using the DAVID web-resource and an appropriate level of abstraction of the annotations, The bar charts depict enriched GO terms of the three datasets compared to the human proteome in the three branches of the GO structure as a function of the EASE score.

References

    1. Stelzl U, Worm U, Lalowski M, Haenig C, Brembeck FH, Goehler H, Stroedicke M, Zenkner M, Schoenherr A, Koeppen S. A human protein-protein interaction network: a resource for annotating the proteome. Cell. 2005;122:957–968. doi: 10.1016/j.cell.2005.08.029. - DOI - PubMed
    1. Rual JF, Venkatesan K, Hao T, Hirozane-Kishikawa T, Dricot A, Li N, Berriz GF, Gibbons FD, Dreze M, Ayivi-Guedehoussou N. Towards a proteome-scale map of the human protein-protein interaction network. Nature. 2005;437:1173–1178. doi: 10.1038/nature04209. - DOI - PubMed
    1. Ewing RM, Chu P, Elisma F, Li H, Taylor P, Climie S, McBroom-Cerajewski L, Robinson MD, O'Connor L, Li M. Large-scale mapping of human protein-protein interactions by mass spectrometry. Mol Syst Biol. 2007;3:89. - PMC - PubMed
    1. Bouwmeester T, Bauch A, Ruffner H, Angrand PO, Bergamini G, Croughton K, Cruciat C, Eberhard D, Gagneur J, Ghidelli S. A physical and functional map of the human TNF-alpha/NF-kappa B signal transduction pathway. Nat Cell Biol. 2004;6:97–105. doi: 10.1038/ncb1086. - DOI - PubMed
    1. Goehler H, Lalowski M, Stelzl U, Waelter S, Stroedicke M, Worm U, Droege A, Lindenberg KS, Knoblich M, Haenig C. A protein interaction network links GIT1, an enhancer of huntingtin aggregation, to Huntington's disease. Mol Cell. 2004;15:853–865. doi: 10.1016/j.molcel.2004.09.016. - DOI - PubMed

LinkOut - more resources