

Sugar consumption and global prevalence of obesity and hypertension: an ecological analysis
- PMID: 23414749
- PMCID: PMC10282320
- DOI: 10.1017/S1368980013000141
Sugar consumption and global prevalence of obesity and hypertension: an ecological analysis
Abstract
Objective: The nutrition transition model provides an integrated approach to analyse global changes in food consumption and lifestyle patterns. Whether variability in food availability for consumption, lifestyle and sociodemographic factors is associated with the worldwide prevalence distribution of overweight, obesity and hypertension is unclear.
Design: Ecological analysis.
Setting: Country-specific prevalence estimates of overweight, obesity and hypertension were obtained. Prevalence estimates were then matched to year- and country-specific food and energy availability for consumption of cereals, sugar, sweeteners and honey, vegetable oils, fruits, starchy roots, pulses, total vegetables, alcoholic beverages, total meat, animal fat, eggs, milk, and fish and seafood. The per capita Gross Domestic Product (GDP), urbanization rates and prevalence of physical inactivity for each country were also obtained.
Subjects: The overweight, obesity and hypertension databases included information from 128, 123 and seventy-nine countries, respectively.
Results: Consumption of sugar and animal products were directly associated with GDP and urbanization rates. In a multivariate regression model, physical inactivity (B = 0·01, se = 0·005, P = 0·003), cereal consumption (B = -0·02, se = 0·006, P < 0·001) and sugar consumption (B = 0·03, se = 0·01, P = 0·03) were significant predictors of obesity prevalence. Midpoint age (B = 0·21, se = 0·10, P = 0·02), prevalence of overweight (B = 0·18, se = 0·08, P = 0·02) and consumption of cereals (B = -0·22, se = 0·10, P = 0·02) were significant predictors of hypertension. Women appeared to have a significant obesity excess compared with men.
Conclusions: High sugar consumption and sedentary lifestyle are associated with increased obesity prevalence. The non-linear association of sugar consumption with prevalence of obesity suggests that effective strategies to reduce its consumption may have differential effects in countries at different stages of the nutrition transition.
Figures
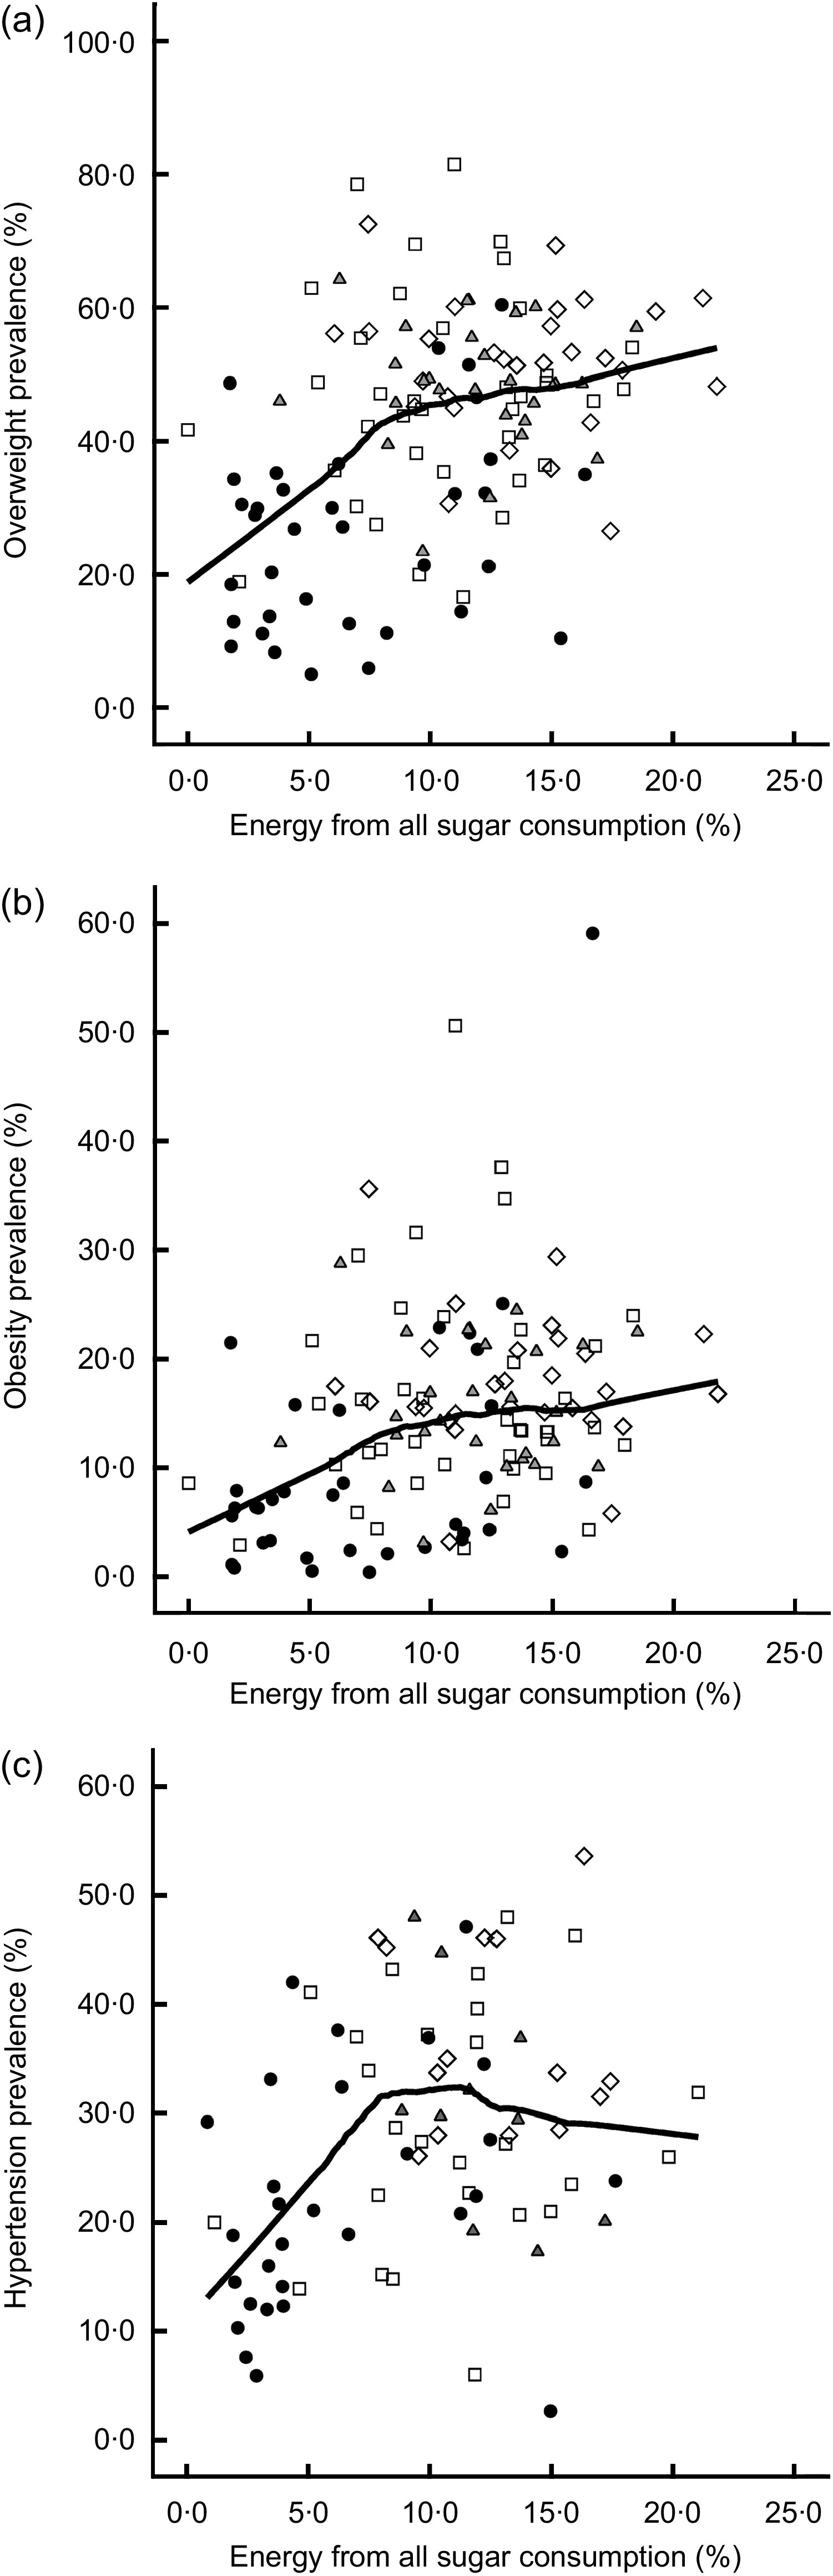
 , <$US 1000 (low);
  , $US 1000–3999 (lower middle);
  , $US 4000–11 999 (upper middle);
  , ≥$US 12 000 (high)).
  shows the fit line for total. Data on overweight, obesity and hypertension from 128, 123 and seventy-nine countries, respectively, which were fit using the LOWESS model with a bandwidth of 0·5
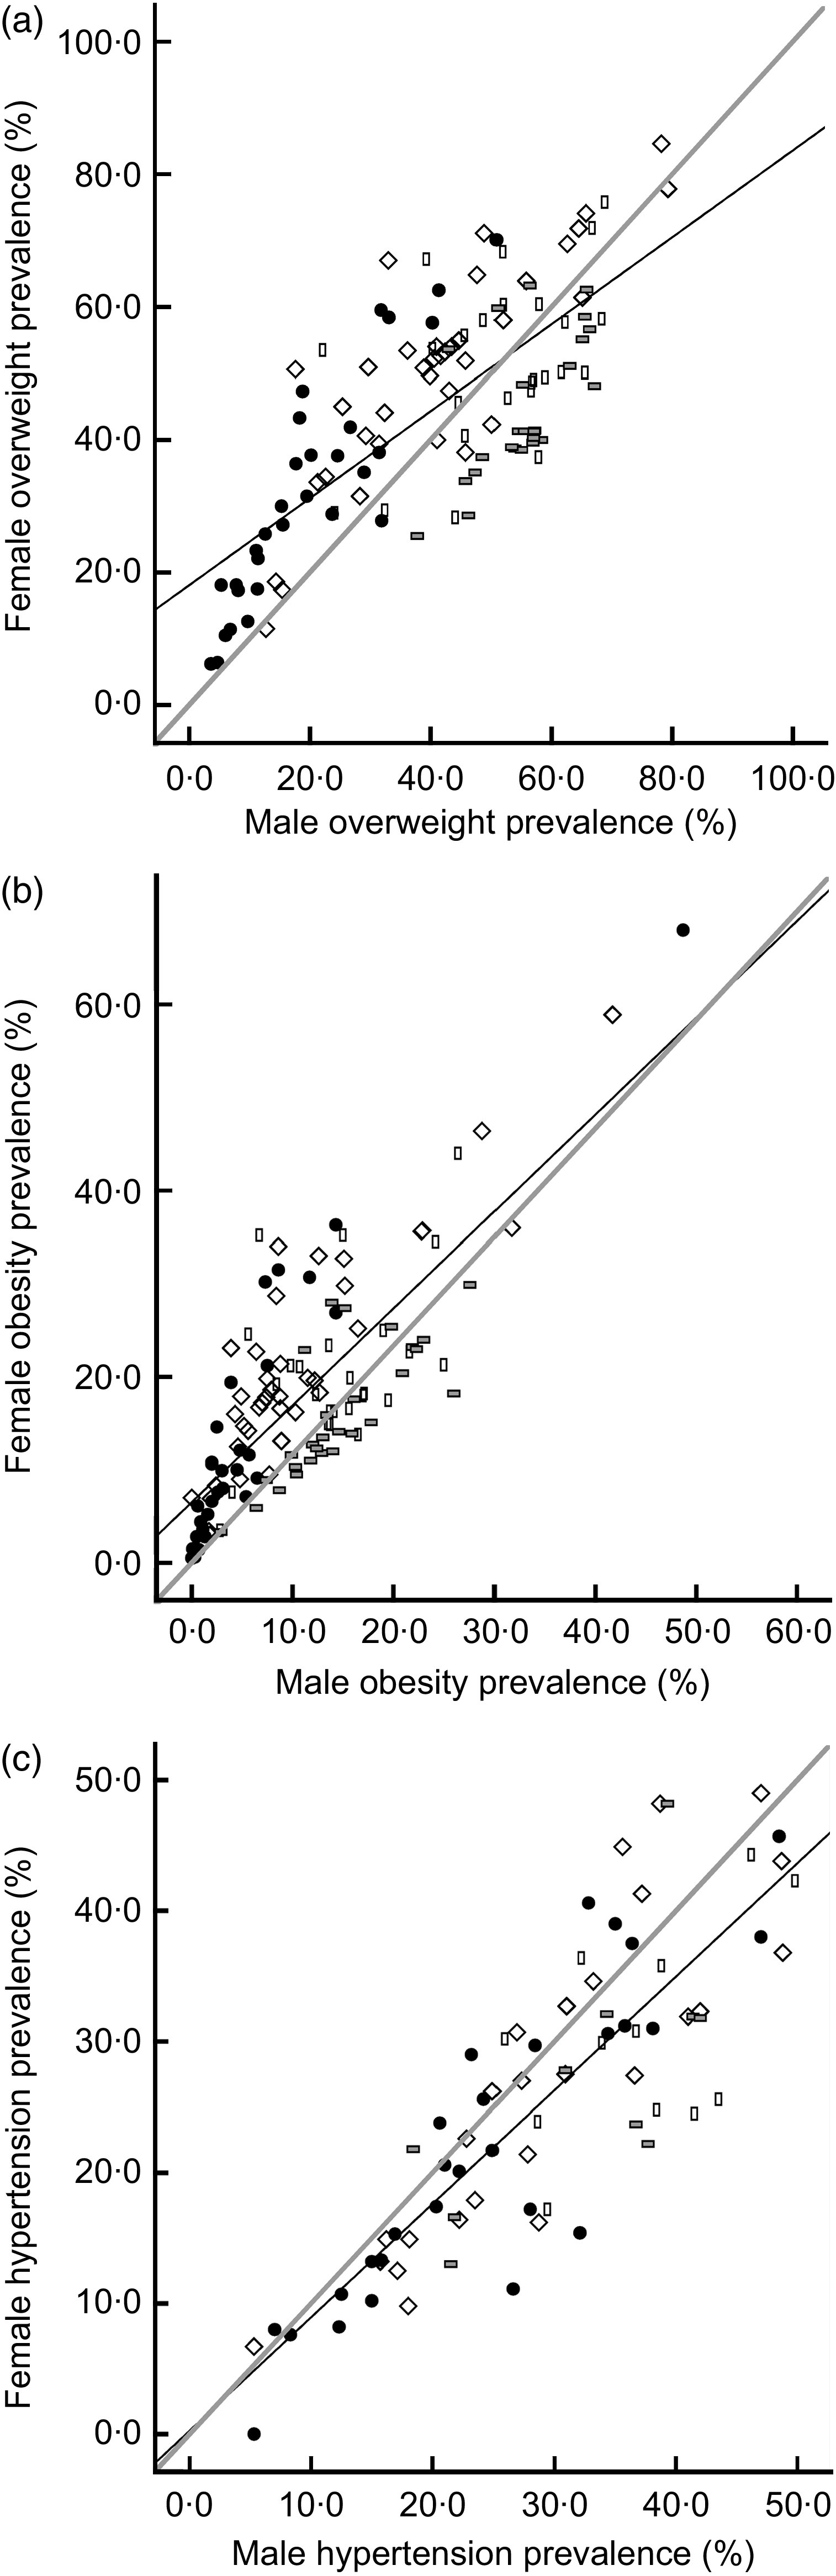
 , <$US 1000 (low);
  , $US 1000–3999 (lower middle);
  , $US 4000–11 999 (upper middle);
  , ≥$US 12 000 (high)).
  shows the regression fit line for total;
  shows the identity line; coefficient of determination R
2 = 0·547 for overweight, 0·603 for obesity and 0·712 for hypertension. Data on overweight, obesity and hypertension from 128, 123 and seventy-nine countries, respectively
shows the identity line; coefficient of determination R
2 = 0·547 for overweight, 0·603 for obesity and 0·712 for hypertension. Data on overweight, obesity and hypertension from 128, 123 and seventy-nine countries, respectivelyReferences
-
- World Health Organization (2003) Diet, Nutrition and the Prevention of Chronic Diseases. Joint WHO/FAO Expert Consultation. WHO Technical Report Series no. 916. Geneva: WHO. - PubMed
-
- Lavie CJ, Milani RV & Ventura HO (2009) Obesity and cardiovascular disease: risk factor, paradox, and impact of weight loss. J Am Coll Cardiol 53, 1925–1932. - PubMed
-
- Danaei G, Finucane MM, Lin JK et al. (2011) National, regional, and global trends in systolic blood pressure since 1980: systematic analysis of health examination surveys and epidemiological studies with 786 country-years and 5·4 million participants. Lancet 377, 568–577. - PubMed
MeSH terms
Substances
Grants and funding
LinkOut - more resources
Full Text Sources
Other Literature Sources
Medical
