. 2013 Apr;53(4):286-96.
doi: 10.1016/j.ceca.2013.01.002. Epub 2013 Feb 12.

Luminal Ca2+ depletion during the unfolded protein response in Xenopus oocytes: cause and consequence

Affiliations

Luminal Ca2+ depletion during the unfolded protein response in Xenopus oocytes: cause and consequence

R Madelaine Paredes et al. Cell Calcium. 2013 Apr.

Abstract

The endoplasmic reticulum (ER) is a Ca(2+) storing organelle that plays a critical role in the synthesis, folding and post-translational modifications of many proteins. The ER enters into a condition of stress when the load of newly synthesized proteins exceeds its folding and processing capacity. This activates a signal transduction pathway called the unfolded protein response (UPR) that attempts to restore homeostasis. The precise role of ER Ca(2+) in the initiation of the UPR has not been defined. Specifically, it has not been established whether ER Ca(2+) dysregulation is a cause or consequence of ER stress. Here, we report that partial depletion of ER Ca(2+) stores induces a significant induction of the UPR, and leads to the retention of a normally secreted protein Carboxypeptidase Y. Moreover, inhibition of protein glycosylation by tunicamycin rapidly induced an ER Ca(2+) leak into the cytosol. However, blockade of the translocon with emetine inhibited the tunicamycin-induced Ca(2+) release. Furthermore, emetine treatment blocked elF2α phosphorylation and reduced expression of the chaperone BiP. These findings suggest that Ca(2+) may be both a cause and a consequence of ER protein misfolding. Thus, it appears that ER Ca(2+) leak is a significant co-factor for the initiation of the UPR.


Figures

Figure 1
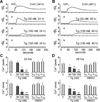
Figure 1. Depletion of luminal Ca2+ by thapsigargin is reflected as a decrease in Ca2+ release
(A-B) Measurement of ER Ca2+ content by confocal imaging of Xenopus oocytes loaded with fluo-4. Representative traces of fluorescence measurements of IP3 induced Ca2+ release are shown. 300 nM IP3 was injected 40 seconds after the beginning of the recording for all groups as indicated by the arrow. Traces represent changes in fluorescence from resting levels as a function of time (ΔF/F) for 24 hrs treatment (A) and 48 hrs Tg treatment (B). The ΔF/F measure of IP3 induced releasable Ca2+ was obtained by selecting a 5×5 pixel area from subsequent images obtained during imaging of individual oocytes. (C-D) Histograms of the Ca2+ release after IP3 injection shown in A in terms of the peak of amplitude (top) or in terms of the area under the curve (bottom) are represented as the means ± SEM of untreated groups (control, C), Tg treated and DMSO (vehicle control) at 24 (C) or 48 (D) hrs of treatment. Values are from n = 3–16 oocytes per group from two independent experiments. Asterisks indicate statistical significance (*p<0.05, **p<0.01, ANOVA).
Figure 2
Figure 2. Thapsigargin treatment induces phosphorylation of eIF2α (ER Stress marker)
(A) Western blot showing phosphorylation levels of eIF2α (ER stress marker) from oocytes treated with Tg or vehicle (DMSO) for 24 hrs. Two oocyte equivalents were loaded per lane and proteins were resolved through 12% SDS-PAGE. Actin western blot is shown as loading control. These gels represent 4 independent western blots with n=20 oocytes per group per experiment. (B) Histograms of the ratio of P-eIF2α normalized with actin (shown in A and C) are represented as the mean ± SEM. Asterisks indicate statistical significance (*p<0.05, ANOVA). (C) Similarly as in A, western blot of P-eIF2α from oocytes treated with Tg or vehicle (DMSO) for 48 hrs. These gels represent 4 independent western blots, n=20 oocytes per group. (D) Histograms of the ratio P-eIF2α normalized with actin are represented as the mean ± SEM. Asterisks indicate statistical significance (*p<0.05, ANOVA).
Figure 3
Figure 3. 48 Hours of Partial Ca2+ Depletion, induces ER Stress in Oocytes co-expressing CPY-wt and CPY-mutant
(A, C) Western blot of P-eIF2α (ER stress marker) from oocytes injected with a combination of mRNA of CPY-wt-mStr and mutant CPYG255R-CFP or non-injected (NI) as indicated. Oocytes were untreated (C) or treated with 50 or 100 nM Tg or vehicle for 24 hrs (A) or 48 hrs (C). Two oocyte equivalents were loaded per lane and proteins were resolved through 12% SDS-PAGE. Actin western blot was used as loading control. These gels represent 3 independent western blots, n=20 oocytes per group. (B, D) Histograms of the ratio P-eIF2α normalized with actin for 24 hrs (B) or 48 hrs (D) are represented as the means ± SEM. Asterisks indicate statistical significance (**p<0.01 ANOVA). Note that ER stress is induced after 48 hours of partial Ca2+ depletion but not after 24 hours.
Figure 4
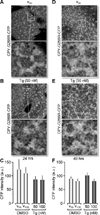
Figure 4. CPYG255R-CFP luminal retention is maintained in untreated or Tg treated oocytes
(A, B, D and E) Confocal images of Xenopus oocytes co-expressing CPYG255R-CFP and CPY-wt-mStr. Images collected using CFP channel (458nm, Argon laser) for excitation to detect only CPYG255R-CFP fluorescence. 24 hrs after mRNA injection, oocytes were treated with 50 nM Tg (shown here in B), 100 nM Tg (not shown) or vehicle for 24 hrs (A). Also shown images of 48 hrs of treatment with vehicle (D) or 50 nM Tg (E). Confocal images were obtained with a 63× objective NA 1.4 oil immersion objective. A magnified image from a region in the field is shown to depict ER like structures. (C, F) Histograms representing fluorescence intensity of ER like structures from CFP emission after 24 hrs treatment (C) or 48 hrs (F) was comparable between Tg treated and vehicle treated oocytes (no statistical significance). Data were plotted as the ratio of fluorescence obtained for Tg normalized with vehicle and vehicle was normalized with fluorescence of untreated oocytes. Histograms of the ratio values are represented as the means ± SEM. Data pooled from 5 independent experiments, n=8–10 oocytes per group per experiment.
Figure 5
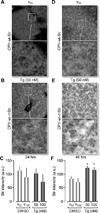
Figure 5. Wild type CPY-Str is only retained in the ER by partial Ca2+ depletion (Tg treatment)
(A, B, D and E) Confocal images of Xenopus oocytes co-expressing CPYG255R-CFP and CPY-wt-Str. Images collected using STR channel (543nm, Helium-Neon Laser) for excitation to detect only CPY-wt- Str fluorescence. 24 hrs after mRNA injection, oocytes were treated with 50 nM Tg (shown here in B), 100 nM Tg (not shown) or vehicle for 24 hrs (A). Also shown images of 48 hrs of treatment with vehicle (D) or 50 nM Tg (E). Confocal images were obtained with a 63× objective NA 1.4 oil immersion objective. A magnified image from a region in the field is shown to depict ER like structures. (C, F) Histograms representing fluorescence intensity of ER like structures from Str emission after 24 hrs treatment (C) or 48 hrs (F) were higher at 48 hrs Tg treatment with statistical significance (*p<0.05, ANOVA). Histograms of the ratio values are represented as the means ± SEM. Data pooled from 5 independent experiments, n=8–10 oocytes per group per experiment.
Figure 6
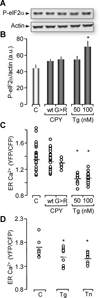
Figure 6. Xenopus oocytes injected with CPYG255R mRNA do not exhibit changes in ER Ca2+ or stress
(A) Western blot of phosphorylation levels of eIF2α from untreated oocytes (C) over-expressing D1ER as Ca2+ indicator, D1ER expressing oocytes treated with 50 nM or 100 nM Tg for 24 hrs or oocytes coexpressing D1ER with CPY-wt (wt) or co-expressing D1ER with mutant CPYG255R (G>R). Two oocyte equivalents were loaded per lane and proteins were resolved through 12% SDS-PAGE. Actin western blot is shown as loading control. Gels represent 4 independent western blots with 15–20 oocytes per group. (B) Histograms of the ratio of P-eIF2α normalized with actin are represented as the means ± SEM. Asterisks indicate statistical significance (*p<0.05, ANOVA). Notice that ER stress was only induced with 100 nM Tg treatment, but no with CPYG255R. (C) ER Ca2+ levels measured by the emission ratio of YFP/CFP in D1ER were plotted as the mean values of individual oocytes. Tg treatment in this experiment was performed for 24 hrs. Data distribution was obtained from 2–6 independent experiments with n= 8–28 oocytes analyzed per group. Asterisks indicate statistical significance (ANOVA, *p<0.05). Notice that Tg-induced Ca2+depletion of the ER was successfully observed with the D1ER indicator. However, no changes in ER Ca2+ levels were observed with CPYG255R (G>R), or CPY-wt (wt) when compared to control oocytes. (D) ER Ca2+ levels were measured and plotted as is indicated in (C). 50 nM Tg treatment was performed for 24 hrs, Tn treatment was performed for 2 hrs. Data distribution was obtained from n= 10 oocytes analyzed per group, (ANOVA, *p<0.05). Notice that ER Ca2+ levels after treatment with Tn for 2 hrs is comparable with 50 nM Tg treatment for 24 hrs.
Figure 7
Figure 7. Emetine, a translocon inhibitor, blocks ER Ca2+ leak and ER stress induced by tunicamycin
(A) (Left) Representative traces of cytosolic Ca2+ change in terms of ΔF/F fluorescence intensity. Data were obtained from oocytes incubated for 2 hrs with 2.5 µg/ml tunicamycin alone (Tn), 0.05% vehicle (Vh) or tunicamycin plus emetine (Tn + Em). For emetine treated oocytes, the last 30 min of incubation with Tn or vehicle were done in the presence of 1 µM emetine. To observe cytosolic Ca2+ changes, all groups were injected with 50 µM fluo-4 30 min before confocal imaging (performed for 5 min). (Right) Histograms represent the change in cytosolic Ca2+ levels (in terms of fluo-4, ΔF/F) between time 0 (rest) to the highest peak after 5 min of imaging (obtained from traces shown on left panel). Histograms represented as the mean ± SEM. Data obtained in 3 experiments, n=8–9 oocytes per group per experiment. (B) Western blot showing phosphorylation levels of eIF2α from untreated oocytes, oocytes treated for 2 hrs with 2.5 µg/ml Tn, or Vh, and Tn + Em. Actin western blots are shown as loading control. For (B), (D) and (F), two oocyte equivalents were loaded per lane and proteins were resolved through 12% SDSPAGE. In (B), these gels represent 4 independent western blots with n=15–20 oocytes per group. (C) Histograms of the ratio of P-eIF2α normalized with actin are represented as the mean ± SEM. (D) Western blot showing protein levels of BiP from untreated oocytes (C), oocytes treated with Tn, and oocytes treated with Tn + Em. These gels represent 3 independent western blots with n=10 oocytes per group. (E) Histograms of the ratio of BiP normalized with actin are represented as the mean ± SEM. Asterisks indicate statistical significance (*p<0.05, **p<0.001, ANOVA).

Similar articles

Cited by

References

    1. Alberts BJ, Lewis A, Raff J, Robberts M, Walter, P K. Garland Science. New York, NY: 2002. Molecular Biology of the Cell.
    1. Hammond C, Helenius A. Quality control in the secretory pathway. Curr Opin Cell Biol. 1995;7:523–529. - PubMed
    1. Berridge MJ. The endoplasmic reticulum: a multifunctional signaling organelle. Cell Calcium. 2002;32:235–249. - PubMed
    1. Li Y, Camacho P. Ca2+-dependent redox modulation of SERCA 2b by ERp57. J Cell Biol. 2004;164:35–46. - PMC - PubMed
    1. Meldolesi J, Pozzan T. The endoplasmic reticulum Ca2+ store: a view from the lumen. Trends Biochem Sci. 1998;23:10–14. - PubMed

Publication types