. 2013 Feb 14;152(4):714-26.
doi: 10.1016/j.cell.2013.01.019.

Evolution and impact of subclonal mutations in chronic lymphocytic leukemia

Affiliations

Evolution and impact of subclonal mutations in chronic lymphocytic leukemia

Dan A Landau et al. Cell. .

Abstract

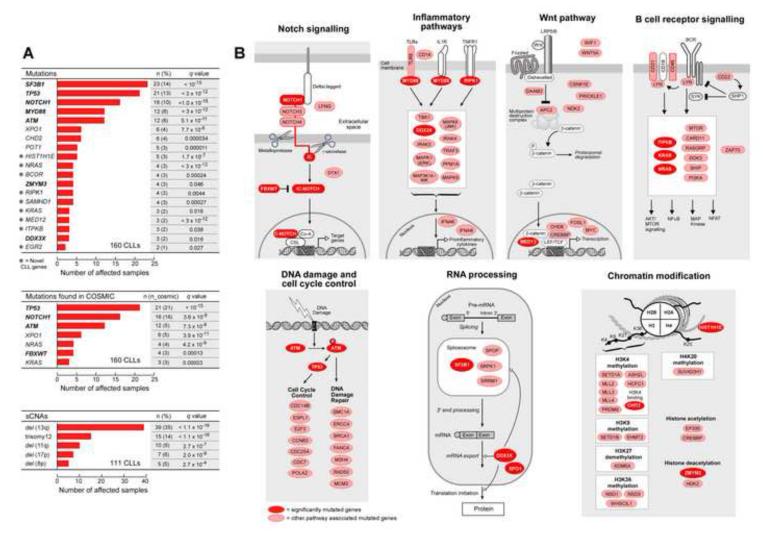
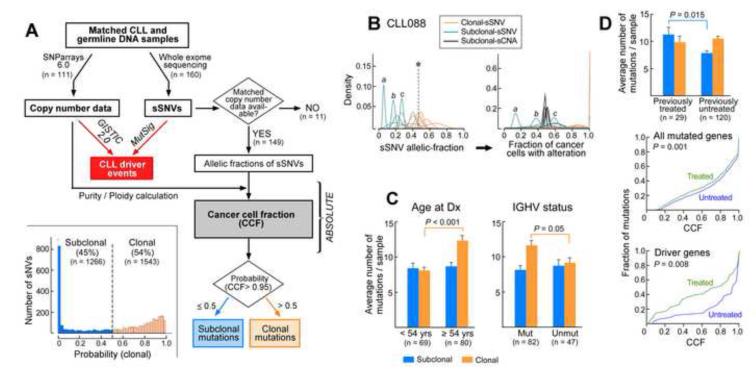
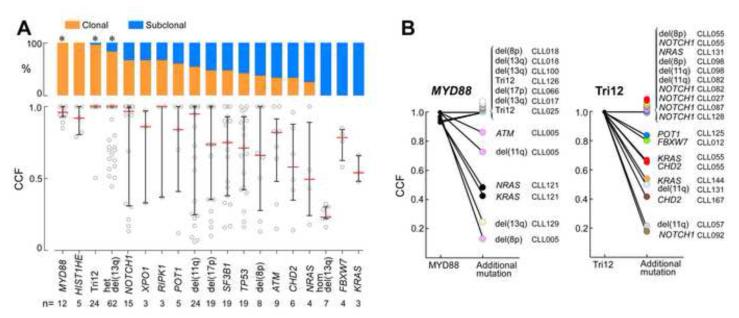
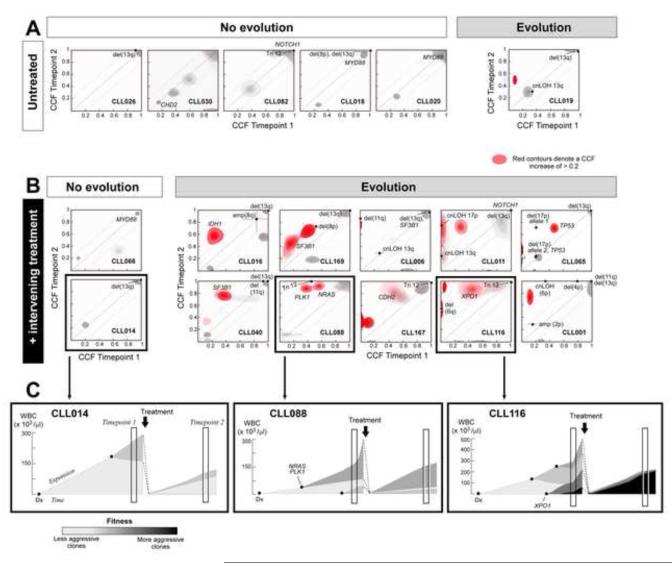
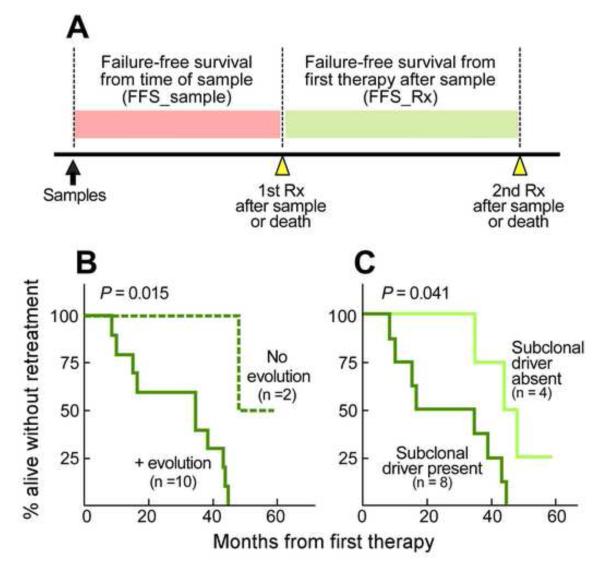
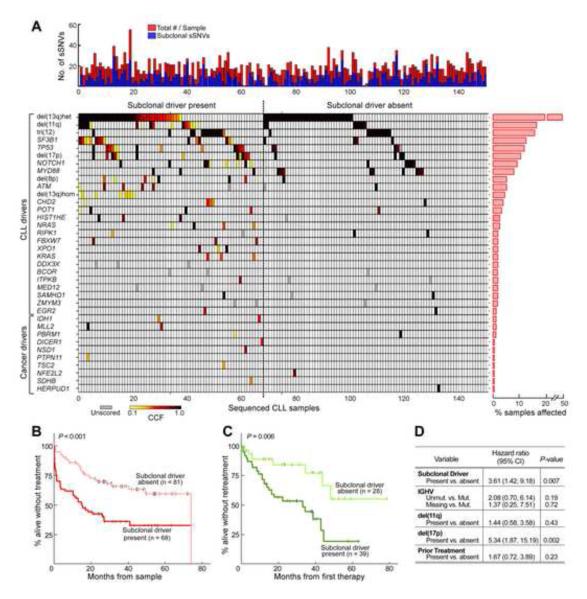
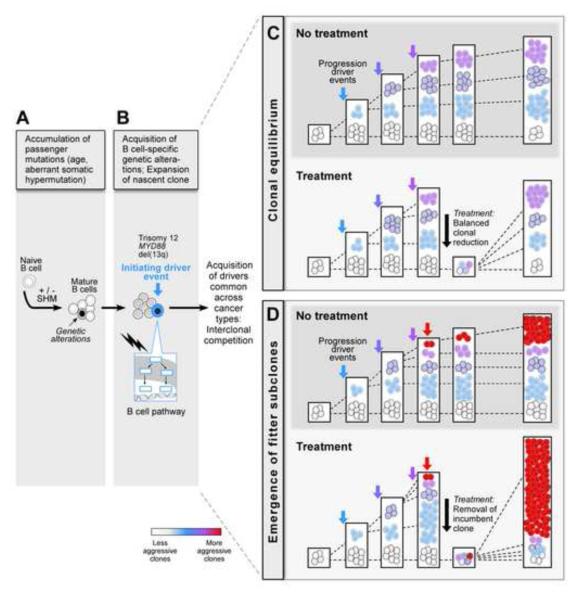
Clonal evolution is a key feature of cancer progression and relapse. We studied intratumoral heterogeneity in 149 chronic lymphocytic leukemia (CLL) cases by integrating whole-exome sequence and copy number to measure the fraction of cancer cells harboring each somatic mutation. We identified driver mutations as predominantly clonal (e.g., MYD88, trisomy 12, and del(13q)) or subclonal (e.g., SF3B1 and TP53), corresponding to earlier and later events in CLL evolution. We sampled leukemia cells from 18 patients at two time points. Ten of twelve CLL cases treated with chemotherapy (but only one of six without treatment) underwent clonal evolution, predominantly involving subclones with driver mutations (e.g., SF3B1 and TP53) that expanded over time. Furthermore, presence of a subclonal driver mutation was an independent risk factor for rapid disease progression. Our study thus uncovers patterns of clonal evolution in CLL, providing insights into its stepwise transformation, and links the presence of subclones with adverse clinical outcomes.


Figures

Figure 1
Figure 1. Significantly mutated genes and associated gene pathways in 160 CLL samples
(A) Mutation significance analysis, using the MutSig2.0 and GISTIC2.0 algorithms identifies recurrently mutated genes and recurrent sCNAs in CLL, respectively. Bold – significantly mutated genes identified in a previous CLL sequencing effort (Wang et al., 2011). * - novel CLL genes identified in the present analysis (Figure S1). ‘n’ – number of samples out of 160 CLLs harboring a mutation in a specific gene; ‘n_cosmic’ – number of samples harboring a mutation in a specific gene at a site previously observed in the COSMIC database. (B) The significantly mutated genes fall into seven core signaling pathways, in which the genes play well-established roles. Red - genes with significant mutation frequencies; pink - additional pathway genes with mutations.
Figure 2
Figure 2. Subclonal and clonal somatic single nucleotide variants (sSNVs) are detected in CLL in varying quantities based on age at diagnosis, IGHV mutation status, and treatment status (also see Figure S2)
(A) The analysis workflow: ‘CLL driver events’ (red box) were identified by mutation significance analysis using WES and SNP array data collected from matched germline and tumor DNA. For the 149 samples that had matched WES and copy number data, ABSOLUTE was applied to estimate the cancer cell fraction (CCF). Mutations were classified as subclonal (blue) or clonal (orange), based on the probability that their CCF is greater than 0.95 (clonal). Inset - Histogram of the probability of being clonal for all sSNVs across 149 CLL samples. (B) A representative example of the transformations generated by ABSOLUTE (for sample CLL088). First, probability density distributions of allelic fractions for each mutation are plotted (representative peaks for sSNVs a, b and c shown). Second, these data are converted to CCF (right panel), incorporating purity and local copy number information. The probability of the event being clonal (i.e affecting >0.95 of cells) is represented by a color spectrum: orange-high probability; blue-low probability. *- allelic fraction of a clonal mutation at multiplicity of 1 (for example, a heterozygous mutation in a diploid region). (C) Comparison of the number of subclonal and clonal sSNVs/sample based on patient age at diagnosis and IGHV mutation status. (D) Comparison of the number of subclonal and clonal sSNVs/sample based on treatment status at time of sample collection (top panel). Cumulative distribution of the sSNVs by CCF is shown for samples from treated and untreated patients for all (middle panel) and only driver sSNVs (bottom panel).
Figure 3
Figure 3. Identification of earlier and later CLL driver mutations (also see Figure S3)
(A) Distribution of estimated cancer cell fraction (CCF) (bottom panel) and percent of the mutations classified as clonal (orange) or subclonal (blue) for CLL drivers (top panel); * - drivers with q-values <0.1 for a higher proportion of clonal mutations compared with the entire CLL drivers set. Het - heterozygous deletion; Hom - homozygous deletion. The analysis includes all recurrently mutated genes (Figure 1A) with 3 or more events in the 149 samples, excluding sSNVs affecting the X chromosome currently not analyzable by ABSOLUTE, and also excluding indels in genes other than NOTCH1. (B) All CLL samples with MYD88 (left) or trisomy 12 (right) and at least 1 additional defined CLL driver (i.e. 9 of 12 samples with mutated MYD88; 14 of 16 tumors with trisomy 12) are depicted. Each dot color denotes separate individual CLL samples.
Figure 4
Figure 4. Longitudinal analysis of subclonal evolution in CLL and its relation to therapy (also see Figure S4)
Joint distributions of cancer cell fraction (CCF) values across two timepoints were estimated using clustering analysis (see Expanded Experimental Procedures). Red - a mutation with an increase in CCF of greater than 0.2 (with probability >0.5). The dotted diagonal line represents y=x, or where identical CCF values across the two timepoints fall; the dotted parallel lines denote the 0.2 CCF interval on either side. Likely driver mutations were labeled. Six CLLs with no intervening treatment (A) and 12 CLLs with intervening treatment (B) were classified according to clonal evolution status, based on the presence of mutations with an increase of CCF > 0.2. (C) Hypothesized sequence of evolution, inferred from the patients’ WBC counts, treatment dates, and changes in CCF for 3 representative examples.
Figure 5
Figure 5. Genetic evolution and clonal heterogeneity results in altered clinical outcome
(A) Schema of the main clinical outcome measures that were analyzed: failure free survival from time of sample (FFS_Sample) and from initiation of first treatment after sampling (FFS_Rx). Within the longitudinally followed CLLs that received intervening treatment (12 of 18), shorter FFS_Rx was observed in CLL samples that (B) had evidence of genetic evolution (n=10) compared to samples with absent or minimal evolution (n=2; Fisher exact test), and that (C) harbored a detectable subclonal driver in the pretreatment sample (n=8) compared to samples with absent subclonal driver (n=4).
Figure 6
Figure 6. Presence of subclonal drivers mutations adversely impacts clinical outcome
(A) Analysis of genetic evolution and clonal heterogeneity in 149 CLL samples. Top panel - total number (red) and the number of subclonal (blue) mutations per sample. Bottom panel - co-occurring CLL or cancer drivers (sSNVs in highly conserved sites in Cancer Gene Census genes) detected in the 149 samples. Color spectrum (light yellow to black) corresponds to estimated cancer cell fraction (CCF); white boxes - not detected; grey – CCF not estimated (genes on the X chromosome and indels other than in NOTCH1). (B-C) Subclonal drivers are associated with adverse clinical outcome. (B) CLL samples containing a detectable subclonal driver (n=68) exhibited shorter FFS_Sample compared to samples with absent subclonal drivers (n=81) (also see Figure S5). (C) Subclonal drivers were associated with shorter FFS_Rx in 67 samples which were treated after sampling. (D) A Cox multivariable regression model designed to test for prognostic factors contributing to shorter FFS_Rx showed that presence of a subclonal driver was an independent predictor of outcome.
Figure 7
Figure 7. A model for the stepwise transformation of CLL
Our data suggest distinct periods in the history of CLL. We observed an increase in clonal mutations in older patients and in the IGHV mutated subtype, likely corresponding to pre-transformation mutagenesis (A). We identified earlier and later mutations in CLL, consistent with B cell-specific (B) and ubiquitous cancer events (C-D), respectively. Finally, clonal evolution and treatment show a complex relationship. Most untreated CLLs and a minority of treated CLLs maintain stable clonal equilibrium over years (C). However, in the presence of a subclone containing a strong driver, treatment may disrupt interclonal equilibrium and hasten clonal evolution (D).

Comment in

References

    1. Alami R, Fan Y, Pack S, Sonbuchner TM, Besse A, Lin Q, Greally JM, Skoultchi AI, Bouhassira EE. Mammalian linker-histone subtypes differentially affect gene expression in vivo. Proc Natl Acad Sci U S A. 2003;100:5920–5925. - PMC - PubMed
    1. Benjamini Y, Hochberg Y. Controlling the false discovery rate: a practical and powerful approach to multiple testing. Journal of the Royal Statistical Society. 1995;57:289–300.
    1. Berger MF, Lawrence MS, Demichelis F, Drier Y, Cibulskis K, Sivachenko AY, Sboner A, Esgueva R, Pflueger D, Sougnez C, et al. The genomic complexity of primary human prostate cancer. Nature. 2011;470:214–220. - PMC - PubMed
    1. Beroukhim R, Mermel CH, Porter D, Wei G, Raychaudhuri S, Donovan J, Barretina J, Boehm JS, Dobson J, Urashima M, et al. The landscape of somatic copy-number alteration across human cancers. Nature. 2010;463:899–905. - PMC - PubMed
    1. Bos JL. ras oncogenes in human cancer: a review. Cancer Res. 1989;49:4682–4689. - PubMed

Publication types

Associated data