. 2013 Apr 4;12(4):413-25.
doi: 10.1016/j.stem.2013.01.017. Epub 2013 Feb 14.

Proliferation-dependent alterations of the DNA methylation landscape underlie hematopoietic stem cell aging

Affiliations

Proliferation-dependent alterations of the DNA methylation landscape underlie hematopoietic stem cell aging

Isabel Beerman et al. Cell Stem Cell. .

Abstract

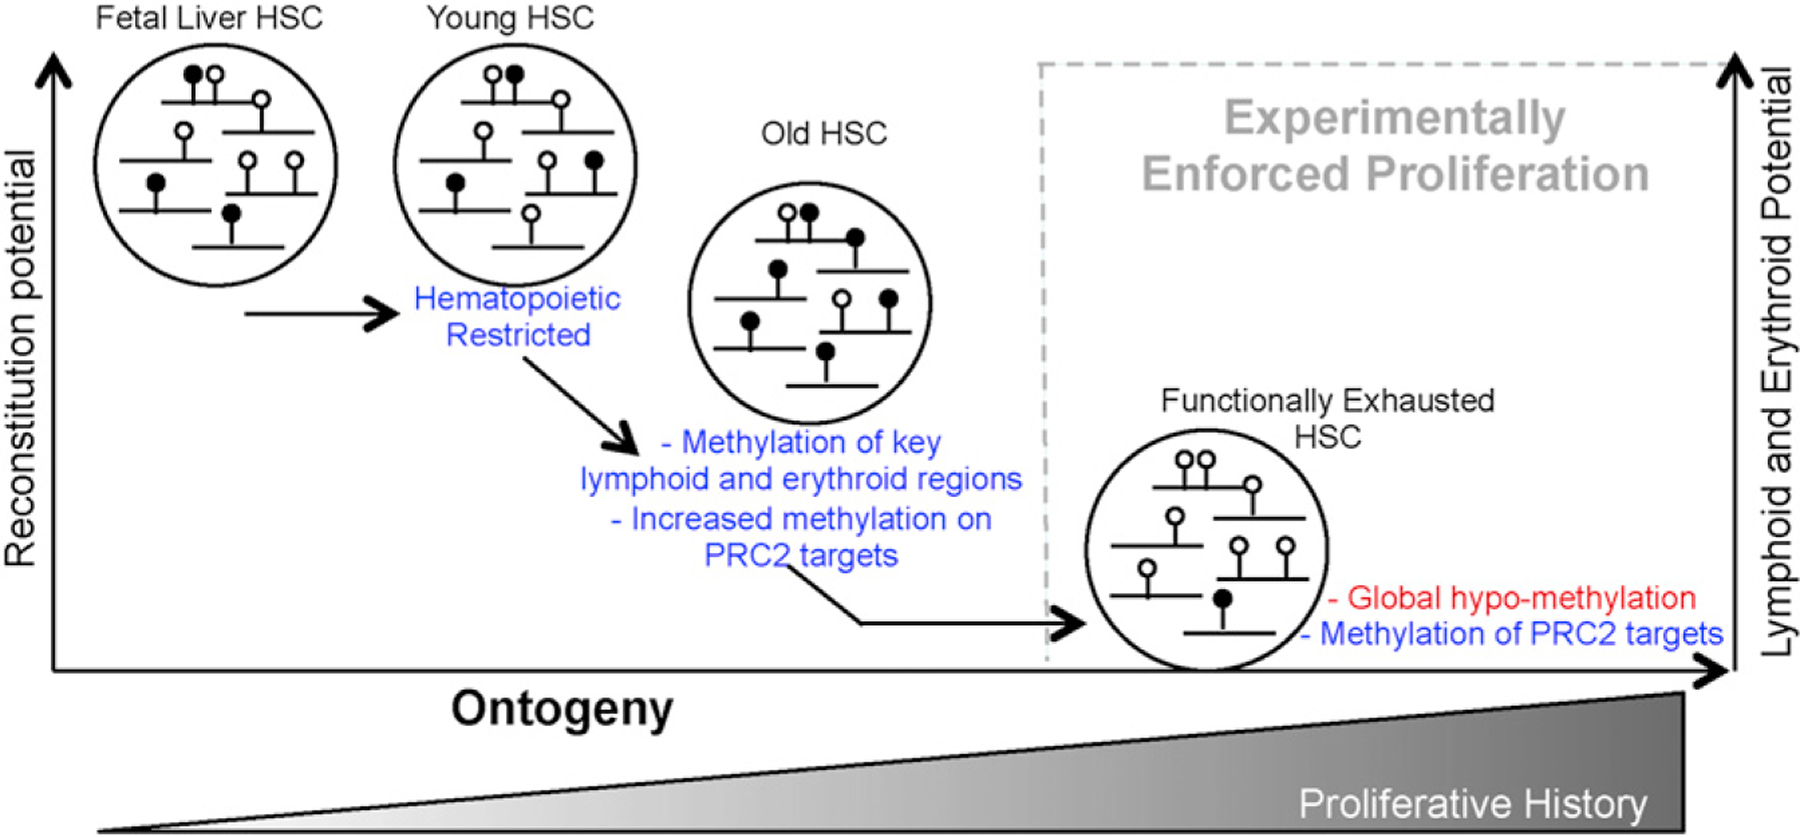
The functional potential of hematopoietic stem cells (HSCs) declines during aging, and in doing so, significantly contributes to hematopoietic pathophysiology in the elderly. To explore the relationship between age-associated HSC decline and the epigenome, we examined global DNA methylation of HSCs during ontogeny in combination with functional analysis. Although the DNA methylome is generally stable during aging, site-specific alterations of DNA methylation occur at genomic regions associated with hematopoietic lineage potential and selectively target genes expressed in downstream progenitor and effector cells. We found that age-associated HSC decline, replicative limits, and DNA methylation are largely dependent on the proliferative history of HSCs, yet appear to be telomere-length independent. Physiological aging and experimentally enforced proliferation of HSCs both led to DNA hypermethylation of genes regulated by Polycomb Repressive Complex 2. Our results provide evidence that epigenomic alterations of the DNA methylation landscape contribute to the functional decline of HSCs during aging.


Figures

Figure 1.
Figure 1.. The Functional Potential of HSCs during Ontogeny Is Accompanied by Locus Specificity in the DNA Methylation Landscape
(A) Schematic overview of experimental design. (B–D) Competitive transplantation of 100 HSCs from fetal liver (FL), young donors (Y), and old donors (O) (n = 8 recipients each) showing (B) total reconstitution, (C) contribution to B cells (B220+) and myeloid (Mac1+) and T cells (CD3+), and (D) granulocyte chimerism at indicated time points. (E) Bone marrow reconstitution 20 weeks posttransplant of recipients described in (B)–(D). (F) Hierarchical clustering of representative 1 kb tiles of DNA methylation data of FL-HSCs, young HSCs, and old HSCs. (G) Bean plots of global DNA methylation of FL-HSCs, young HSCs, and old HSCs. (H) Number of 1 kb tiles with significant methylation differences in pairwise comparisons between HSCs isolated from different stages of ontogeny. Total comparisons with sufficient DNA methylation data from both populations: FL-Y = 98,112, Y-O = 98,635. (I and J) Chromatin enrichment of regions with significant methylation changes from FL-HSCs to young HCs (I) and young to old HSCs (J) showing Q values and Log2Odds scores. Significant differences: *p < 0.05, **p < 0.01, ***p < 0.001 (t test). Error bars show SEM. See also Figures S1 and S2, Table S1, Table S2, Table S3, and Table S4.
Figure 2.
Figure 2.. DNA Methylation Changes during HSC Ontogeny Largely Target Genes Expressed in Downstream Hematopoietic Progeny
(A) Hierarchical clustering of representative expression profiles of FL-HSCs, young HSCs, and old HSCs. (B) Heatmap plots of relative gene expression profiles with ≥2× expression change, p ≤ 0.001, and FDR ≤ 0.05 between ontogeny stages. (C) Correlation between differences in DNA methylation of core promoters, promoter regions, and gene loci with expression. (D) Genes showing significant changes in DNA methylation expressed in ≥1 of 39 hematopoietic cell types during transitions of ontogeny. Genes expressed in HSCs and downstream cells (leftmost of each comparison group) were categorized as significantly higher in HSCs compared to downstream cells (HSC higher), significantly higher in downstream cells compared to HSCs (Downstream higher), and having no significant changes in expression. Significant expression differences were defined as ≥1.5-fold average expression with p ≤ 0.01. Remaining genes were exclusively expressed in HSCs (HSC only, middle of each comparison group), or exclusively expressed in downstream progeny (Downstream only, rightmost of each comparison group). (E) Representative genes with significant DNA methylation differences in old compared to young HSCs expressed exclusively in downstream cells. DNA methylation differences and gene expression pattern in hematopoiesis are shown (Seita et al., 2012). Gene regions presented are Blnk, chr19: 41,060,000–41,072,000; Irf8, chr8: 123,248,000–123,277,000; and Ank1, chr8: 24,251,000–24,257,000. Single CpGs with significant differential DNA methylation are denoted with asterisks (*). Transcription start sites (TSS, tall arrow), untranscribed regions (white boxes) and exons (black boxes) are shown. Promoter Region: —20 kb of TSS; Core Promoter: —5 kb to +1 kb of TSS; Gene Body: within gene. See also Figure S3, Table S5, and Table S6.
Figure 3.
Figure 3.. Increased HSC Proliferation Leads to Functional Decline and Differential DNA Methylation that Recapitulates Physiological HSC Aging
(A) Schematic overview of experimental design. (B–D) Bone marrow analysis of mice receiving four (4×), two (2×) or zero (0×) administrations of 5-fluorouracil (5-FU) (n = 8) 2 months postfinal 5-FU administration. Shown are (B) the primitive LSK compartment and (C) breakdown of the primitive LSK compartment as follows: HSC (CD34 Flk2), MPPFlk2— (CD34+ Flk2) and MPPFlk2+ (CD34+ Flk2+), and LSK compartment of old mice (right), with (D) CD150 subsets of HSCs (Beerman et al., 2010a; Morita et al., 2010). (E and F) Total reconstitution of recipient mice transplanted with 1 × 10⁶ WBM cells from mice that received 4×, 2×, or 0× 5-FU against 1 × 10⁶ young competitor BM cells (E) and lineage contribution to B cells (B220+), myeloid cells (Mac1+), and T (CD3+) cells at indicated times posttransplant (F) (n = 6 recipients each). (G) Number of 1 kb tiles with significant differential DNA methylation as determined by pairwise comparisons between HSCs after 5-FU receipt and HSCs from untreated young (Y) mice. Total comparisons with sufficient DNA methylation information for both populations were as follows: Y-2× = 84,510, Y-4× = 88,704. (H) Overlap of 1 kb intervals with significant gains or losses of DNA methylation in comparisons between enforced HSC proliferation (2× or 4× 5-FU) either in untreated young HSCs or during HSC aging (young to old) showing p values, Log2Odds scores, and total comparisons. Significant differences: *p < 0.05, **p < 0.01, ***p < 0.001 (t test). Error bars show SEM. See also Figure S4.
Figure 4.
Figure 4.. The Replicative Limits of HSCs Are Proliferative History Dependent, Yet Independent of Telomere Length
(A) Schematic overview of experimental design. (B) Total donor BM reconstitution, 20 weeks posttransplant, of recipient mice transplanted with 500, 50, or 10 young HSCs (CD45.1) and 500, 50, and 10 old HSCs (CD45.2) (respectively) and a radio-protective dose of Sca1-depleted bone marrow cells (CD45.1/2). (C and D) Competitive secondary transplantation of 200 donor-derived HSCs from the primary transplants of 500, 50, or 10 young HSCs (n = 7, 4, or 5 recipients, respectively) against 2 × 10⁵ competitor BM cells showing (C) total reconstitution and (D) granulocyte chimerism. (E) Total donor BM reconstitution of the recipients described in (B) and (C) 20 weeks postsecondary transplant. (F) Single-cell qPCR telomere length analysis of donor-derived granulocytes isolated from primary recipients of 500, 50, or 10 young HSCs (left, n≥14) or secondary (right, n≥28) recipients measured at 12 and 8 weeks posttransplant, respectively. Significant differences: *p < 0.05, **p < 0.01, ***p < 0.001 (t test). Error bars show SEM. See also Figures S5 and S6.
Figure 5.
Figure 5.. The Replicative Limit of HSCs Is Associated with Global DNA Hypomethylation
(A) Bean plot of global DNA methylation of steady-state young HSCs and donor-derived HSCs isolated from primary recipients of 500, 50, or 10 transplanted young HSCs. (B)Number of 1 kb tiles with significant DNA methylation differences in pairwise comparisons of HSCs derived from initial transplants of 500, 50, and 10 young HSCs to steady-state young HSCs. Total comparisons with sufficient DNA methylation information for both populations are as follows: Y-Y500 = 98,301, Y-Y50 = 97,872, Y-Y10 = 89,051. (C) Overlap of 1 kb intervals with significant differential DNA methylation in comparisons between young transplanted HSCs (500, 50, or 10 HSCs) to young HSCs, and also during HSC aging (young to old), showing p values, Log2Odds scores, and total comparisons. See also Figure S5.
Figure 6.
Figure 6.. Targeted DNA Hypermethylation of PRC2 Regulated Genes Accompanies Proliferation-Dependent HSC Aging
(A) Overlap of 1 kb intervals with significant differential methylation in composite comparisons of HSCs subjected to experimentally enforced proliferation (EP) to young HSCs (Y) (Y-EP) and during HSC aging (Y-O) showing p values, Log2Odds scores, and total comparisons. Comparisons include 1 kb regions with methylation information in young and old mice, and at least six of the eight samples subjected to EP with threshold significance set at n-2 with significant changes. (B) Gene set enrichment analysis of the 438 loci with consistent gains of methylation after EP and during HSC aging identified in (A) showing Q values and Log2Odds scores. (C) qPCR-generated relative expression values of PRC2 components from young and old HSCs showing individual measurements of sorted HSCs (10 cells), (n ≥ 23). Significant differences: *p < 0.05, **p < 0.01, ***p < 0.001 (t test). Error bars show SEM. See also Table S7.
Figure 7.
Figure 7.. Model of the Changing DNA Methylation Landscape and Functional Potential of HSCs during Ontogeny
Schematic representation of DNA methylation changes in HSCs (white lollipop, unmethylated CpGs; black lollipop, methylated CpGs) and the functional alterations associated with HSC ontogeny as indicated (y axes).

References

    1. Adolfsson J, Månsson R, Buza-Vidas N, Hultquist A, Liuba K, Jensen CT, Bryder D, Yang L, Borge OJ, Thoren LA, et al. (2005). Identification of Flt3+ lympho-myeloid stem cells lacking erythro-megakaryocytic potential a revised road map for adult blood lineage commitment. Cell 121, 295–306. - PubMed
    1. Agherbi H, Gaussmann-Wenger A, Verthuy C, Chasson L, Serrano M, and Djabali M (2009). Polycomb mediated epigenetic silencing and replication timing at the INK4a/ARF locus during senescence. PLoS ONE 4, e5622. - PMC - PubMed
    1. Allsopp RC, Cheshier S, and Weissman IL (2001). Telomere shortening accompanies increased cell cycle activity during serial transplantation of hematopoietic stem cells. J. Exp. Med 193, 917–924. - PMC - PubMed
    1. Allsopp RC, Morin GB, Horner JW, DePinho R, Harley CB, and Weissman IL (2003). Effect of TERT over-expression on the long-term transplantation capacity of hematopoietic stem cells. Nat. Med 9, 369–371. - PubMed
    1. Beerman I, Bhattacharya D, Zandi S, Sigvardsson M, Weissman IL, Bryder D, and Rossi DJ (2010a). Functionally distinct hematopoietic stem cells modulate hematopoietic lineage potential during aging by a mechanism of clonal expansion. Proc. Natl. Acad. Sci. USA 107, 5465–5470. - PMC - PubMed

Publication types

Substances

Associated data