. 2013 Mar 7;49(5):884-96.
doi: 10.1016/j.molcel.2013.01.013. Epub 2013 Feb 14.

Structure of a ubiquitin E1-E2 complex: insights to E1-E2 thioester transfer

Affiliations

Structure of a ubiquitin E1-E2 complex: insights to E1-E2 thioester transfer

Shaun K Olsen et al. Mol Cell. .

Abstract

Ubiquitin (Ub) conjugation is initiated by an E1 enzyme that catalyzes carboxy-terminal Ub adenylation, thioester bond formation to a catalytic cysteine in the E1 Cys domain, and thioester transfer to a catalytic cysteine in E2 conjugating enzymes. How the E1 and E2 active sites come together during thioester transfer and how Ub E1 interacts with diverse Ub E2s remains unclear. Here we present a crystal structure of a Ub E1-E2(Ubc4)/Ub/ATP·Mg complex that was stabilized by induction of a disulfide bond between the E1 and E2 active sites. The structure reveals combinatorial recognition of the E2 by the E1 ubiquitin-fold domain (UFD) and Cys domain and mutational analysis, coupled with thioester transfer assays with E1, Ubc4, and other Ub E2s, show that both interfaces are important for thioester transfer. Comparison to a Ub E1/Ub/ATP·Mg structure reveals conformational changes in the E1 that bring the E1 and E2 active sites together.


Conflict of interest statement

Author Information Atomic coordinates and structure factors are deposited in the RCSB with accession codes 4II2 and 4II3. The authors declare no competing financial interests.

Figures

Figure 1
Figure 1. E1/Ub/ATP·Mg and E1-E2/Ub/ATP·Mg structures
(A) Cartoon of the Uba1/Ub/ATP·Mg complex with Uba1 domains color coded and labeled. E1 catalytic cysteine and ATP shown as CPK colored spheres and magnesium ions as cyan spheres. AAD and IAD stand for active and inactive adenylation domains, respectively, FCCH is first catalytic cysteine half domain. (B) Chemical structures of Ub/Ubl during E1-E2 thioester transfer (left) and the E1-E2 disulfide linked complex (right). Active site cysteine residues, E1, E2 and Ub/Ubl are labeled. (C) Three views of a cartoon representation of the Uba1-Ubc4/Ub/ATP·Mg complex labeled and colored as in A. The disulfide bridge linking E1 and E2 cysteines is indicated by an arrow. Front view of the structure shown in the left panel, a top/down view in the center panel, and a side view in the right panel.
Figure 2
Figure 2. Conformational changes bring E1 and E2 active sites together
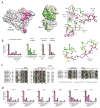
(A) Model of a Ub E1/E2 complex with a distal UFD conformation generated by docking Ubc4 onto the UFD of the Uba1/Ub/ATP·Mg structure reveals a 25 Å separation between E1 and E2 active sites. A loop in the Uba1 Cys domain that covers the E1 catalytic cysteine (Cys cap; colored cyan) is disordered in the Uba1-Ubc4/Ub/ATP·Mg structure. (B) UFD conformations indicating a path from distal to proximal by superposition Uba1-Ubc4/Ub/ATP·Mg (red; proximal), Uba1/Ub/ATP·Mg (red; distal) and S. cerevisiae Uba1 (light blue; dark blue) in intermediate conformations (left panel). UFD rotation from distal to proximal breaks intramolecular contacts between the β-hairpin and UFD core (right panel). ‘apo’ refers to E1 in the absence of E2. (C) UFD (red) as in B showing E2 (green) docked onto UFDs based on UFD/Ubc4 interactions in the Uba1-Ubc4/Ub/ATP·Mg structure. E1 adenylation and Cys domains colored gray. UFDs undergo rigid body rotation along a direct path from distal to proximal conformations to bring the E1 and E2 active sites together.
Figure 3
Figure 3. Ubc4/Uba1 Cys domain interface
(A) Surface representation of Uba1 Cys domain and Ubc4 shown in open book representation with residues in the interface colored pink or magenta (Cys domain) and yellow or green (E2). Residues deemed most important for thioester transfer are colored magenta (Cys domain) and green (Ubc4). Right panels show stick and cartoon composite of the Cys domain (magenta) and Ubc4 (green) interface with potential hydrogen bonds as dashed lines. The region surrounding the E1 and E2 active sites (top right) and E2 contacts to the E1 crossover loop and ubiquitin (yellow; bottom right). (B) Structure-function analysis of the Cys domain/Ubc4 interface. Uba1-Ubc4 thioester transfer assays performed as described in Methods and plotted as percent activity relative to wild type. (C) Structure-based sequence alignment for S. pombe Ub E2s (left) and other Uba1s (right) depicting regions in the E1 Cys domain/E2 interface. Ubc4 and Uba1 residues in direct contact indicated by magenta and green circles, respectively, above the alignment. Positions subjected to mutational analysis indicated by a star below the alignment. Residues in the alignment are colored black (hydrophobic), gold (charged) and silver (polar). Identities and similarities in E2 alignment indicated to the right. (D) Thioester transfer activities of Uba1 Cys domain mutants as in B with indicated S. pombe Ub E2s. Error bars in B and D represent ± 1 standard deviation and were derived from three independent experiments.
Figure 4
Figure 4. Doubly loaded Uba1-Ubc4
(A) Model of doubly loaded Uba1 in the absence of E2 indicating potential Ub(t) positions derived by superposition of E2s from available E2~Ub thioester structures onto Ubc4 in the E1-E2 structure. Uba1 in surface representation with domains color-coded as in Figure 1C. The catalytic cysteine (yellow sphere) and Cys cap (cyan) are labeled and indicated by arrows and Ub(t)s as ribbons. Ub(t)s that extend away from the E1/E2 active sites towards the front of Uba1 can be accommodated without steric clashes. It is unknown if the Cys cap is ordered or disordered in the Uba1~Ub thioester complex. (B) Doubly loaded Ub E1/E2 model with UFD in a distal conformation. Ub(t) derived from Ubc1~Ub(t) (PDB 1FXT) as described in A. Ubc4 was docked onto apo Uba1 as described in Figure 2A. Ub(t) does not clash with the E2 or E1 in the model. (C) Doubly loaded Ub E1/E2 model with UFD in the proximal conformation. A channel formed by E1 and E2 residues leads to the active sites as highlighted in the center panel and close-up in the right panel (Ub(t) colored orange and E1 and E2 residues colored magenta and green, respectively, other components labeled and colored grey). Location of the FCCH loop that projects towards the channel is labeled and indicated by an arrow. (D) Thioester transfer activity of Uba1 and mutants containing two (LiS), seven (LiM), and eleven (LiL) amino acid insertions in the FCCH loop as described in Methods. Error bars derived from three independent experiments and represent ± 1 standard deviation.
Figure 5
Figure 5. Ubiquitin E1 UFD interactions with E2
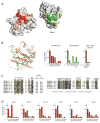
(A) Surface representation of the Uba1 UFD/Ubc4 interface in open book representation with residues in the interface colored orange and red (UFD) and yellow and green (E2). Residues deemed important for thioester transfer activity are red (UFD) and green (E2). (B) Ribbon representation of the UFD/Ubc4 interface with side chains of select residues shown as sticks (left). Uba1-Ubc4 thioester transfer assays (right) performed as described in Methods and plotted as percent activity relative to wild type. (C) Structure-based sequence alignment for S. pombe Ub E2s (left) and Uba1s (right) depicting regions in the UFD/E2 interface. Ubc4 and Uba1 UFD residues in direct contact indicated by red and green circles above the alignment, respectively. Residues subjected to mutational analysis indicated by a star below the alignment. Residues in the alignment are shaded as in Figure 3C with identity and similarity of the sequences in the E2 alignment shown to the right. (D) Thioester transfer activities of Uba1 UFD mutants as in B with indicated S. pombe Ub E2s. Error bars in panels B and D represent ± 1 standard deviation and were derived from three independent experiments.
Figure 6
Figure 6. E2-E1 UFD interactions in Ub, SUMO and Nedd8 pathways
(A) Cartoon representation of Ubc12/Uba3UFD (Huang et al., 2007; left), Ubc4/Uba1UFD (middle), and Ubc9/Uba2UFD (Wang et al., 2010; right) generated by superposition of the UFDs. Ubc4 (green), Ubc12 (blue), Ubc9 (orange), Uba1UFD (red), Uba3UFD (brown), Uba2UFD (pink) with the E2 catalytic cysteine as a yellow sphere. (B) Structures as in A aligned by superposition of E2s. Structural elements within UFDs and E2s that would preclude noncognate E1-E2 interactions labeled and indicated by dashed ovals and arrows. Individual structures shown to the left/right of superposition for reference. Structure-based sequence alignment (bottom) of E1 and E2 elements within the E2/E1 UFD interface derived from Figure S3. Residues in direct contact are shaded green and red for E1 and E2, respectively. Secondary structure indicated above the alignment and amino acid numbers indicated to the left of the alignment.
Figure 7
Figure 7. E2-E1 Cys domain interactions in Ub, SUMO and Nedd8 pathways
(A) Model of SUMO Ubc9 and SUMO E1 Uba2CysDomain derived from Uba1-Ubc4/Ub/ATP·Mg by superposition of E1s Uba2 (PDB 3KYC) and Uba1 encompassing adenylation and Cys domains followed by superposition of Ubc9 onto Ubc4. (B) Model of Nedd8 Ubc12 and Nedd8 E1 derived from PDB 2NVU as described in A. The Nedd8 E1 Cys domain is smaller than in Ub and SUMO E1 but a large insertion in the AppBP1 is proximal to the E2. Structural elements unique to the Nedd8 E1 and predicted to form contacts with the E2 are labeled and indicated by arrows. (C) Ub E1-E2 complex displayed in the same orientation to allow for direct comparison to A and B. Structural elements unique to the Ub E1 that contact the E2 are labeled and indicated by arrows. (D) Model of Ub E1 SUMO E2 (Ubc9) created by superposition of Ubc9 to Ubc4 in the Uba1-Ubc4 structure depicting clashes between Ubc9 Y134 and the Uba1 hydrophobic patch. Select residues are labeled and shown as sticks. (E) Model of Ub E1 Nedd8 E2 created by superposition of Ubc12 to Ubc4 from the Uba1-Ubc4 structure depicting clashes between Ubc12 K147 and the Uba1 hydrophobic patch. (F) Ub E1-E2 complex displayed in the same orientation to allow for direct comparison to D and E. (G) Structure-based sequence alignment of E1 and E2 elements within the E2/E1 Cys domain interface derived from Figure S3. Residues in direct contact are shaded green and magenta for E1 and E2, respectively. Secondary structure indicated above the alignment and amino acid numbers indicated to the left of the alignment.

References

    1. Bossis G, Melchior F. Regulation of SUMOylation by reversible oxidation of SUMO conjugating enzymes. Mol Cell. 2006;21:349–357. - PubMed
    1. Capili AD, Lima CD. Taking it step by step: mechanistic insights from structural studies of ubiquitin/ubiquitin-like protein modification pathways. Curr Opin Struct Biol. 2007;17:726–735. - PMC - PubMed
    1. Deshaies RJ, Joazeiro CA. RING domain E3 ubiquitin ligases. Annu Rev Biochem. 2009;78:399–434. - PubMed
    1. Doris KS, Rumsby EL, Morgan BA. Oxidative stress responses involves oxidation of a conserved ubiquitin pathway enzyme. Mol Cell Biol. 2012;32:4472–4481. - PMC - PubMed
    1. Dou H, Buetow L, Sibbet GJ, Cameron K, Huang DT. BIRC7-E2 ubiquitin conjugate structure reveals the mechanism of ubiquitin transfer by a RING dimer. Nat Struct Mol Biol. 2012;19:876–883. - PMC - PubMed

Publication types

MeSH terms