. 2013 Apr;16(4):407-15.
doi: 10.1038/nn.3333. Epub 2013 Feb 17.

EGF transactivation of Trk receptors regulates the migration of newborn cortical neurons

Affiliations

EGF transactivation of Trk receptors regulates the migration of newborn cortical neurons

Dirk Puehringer et al. Nat Neurosci. 2013 Apr.

Abstract

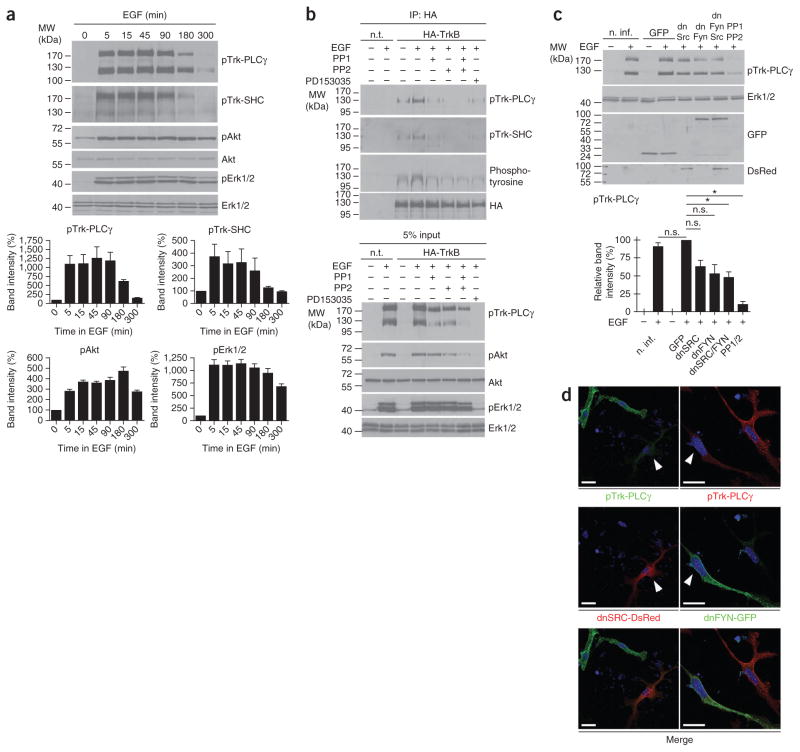
The development of neuronal networks in the neocortex depends on control mechanisms for mitosis and migration that allow newborn neurons to find their accurate position. Multiple mitogens, neurotrophic factors, guidance molecules and their corresponding receptors are involved in this process, but the mechanisms by which these signals are integrated are only poorly understood. We found that TrkB and TrkC, the receptors for brain-derived neurotrophic factor (BDNF) and neurotrophin-3 (NT-3), are activated by epidermal growth factor receptor (EGFR) signaling rather than by BDNF or NT-3 in embryonic mouse cortical precursor cells. This transactivation event regulated migration of early neuronal cells to their final position in the developing cortex. Transactivation by EGF led to membrane translocation of TrkB, promoting its signaling responsiveness. Our results provide genetic evidence that TrkB and TrkC activation in early cortical neurons do not depend on BDNF and NT-3, but instead on transactivation by EGFR signaling.


Conflict of interest statement

COMPETING FINANCIAL INTERESTS

The authors declare no competing financial interests.

Figures

Figure 1
Figure 1
Expression and activation of TrkB by EGF in cortical precursors. (a) TrkB and pTrk-PLCγ levels in embryonic and early postnatal mouse forebrain. (b) TrkB and pTrk immunoreactivity in Pax6- and nestin-positive cells of the ventricular zone, and doublecortin (DcX)-positive cells in the early cortical plate. Scale bars represent 150 μm, 50 μm and 25 μm in the top panels (left to right), 25 μm in the middle panels, and 50 μm in the lower panels. (c) Levels of TrkB activation after immunoprecipitation of TrkB from E13 forebrain from Bdnf−/−, Ntf3−/− and Bdnf−/−; Ntf3−/− mice, and corresponding wild-type littermates detected with antibodies to pTrk-PLCγ, pTrk-SHC and phospho-tyrosine. (d) Quantitative analysis did not reveal significant differences of TrkB activation between Bdnf−/−, Ntf3−/−, Bdnf−/−; Ntf3−/− and wild-type mice when tested by one-sample t test. Data represent mean ± s.e.m. For full-length blots, see Supplementary Figures 1 and 10.
Figure 2
Figure 2
EGF is the major activator of TrkB in cortical precursor cells. (a) EGF, but not BDNF, treatment resulted in phosphorylation of Trk (Trk-PLCγ) and Erk1/2 in cultured forebrain cortical precursor cells. To quantify phosphorylation levels of Trk, we analyzed densitometric scans of immunoblots. Levels of pTrk in unstimulated cells were defined as 100% (mean ± s.e.m., one sample t test). (b) EGF treatment led to rapid elevation of pTrk-PLCγ immunoreactivity in cultured nestin-positive forebrain cortical precursor cells. Measured intensities are shown as arbitrary units ± s.e.m. (*P < 0.001, one-way ANOVA). Scale bars represent 25 μm. (c) Isolated cortical precursor cells (E12) from neurosphere cultures consisted mainly of Pax6-positive precursors and showed strong induction of TrkB phosphorylation, but no substantial response to BDNF or NT-3. Similar responses to EGF, BDNF and NT-3 were observed in acutely isolated cortical precursors from E11 forebrain vesicles directly cultured for 24 h. Acutely plated primary cells from E12 forebrain grown for 24 h showed a robust response to EGF, but also to BDNF and NT-3. At E15, the response to BDNF and NT-3 was predominant, although TrkB phosphorylation following EGF treatment was still detectable. From E11 to E15, the percentage of Pax6-positive precursor cells decreased, whereas the percentage of MAP2-positive neurons increased. Scale bars represent 25 μm. (d) Coexpression of EGFR and TrkB in E13 forebrain. Scale bars represent 150 μm (top panels) and 50 μm (lower panels). For full-length blots, see Supplementary Figure 10.
Figure 3
Figure 3
Characterization of TrkB transactivation by EGFR signaling. (a) Phosphorylation of Trk receptors by EGF treatment at both the PLCγ- and SHC-binding domains. Activation correlated with phosphorylation of Akt (Ser473) and Erk1/2. Time-dependent phosphorylation of Trk, Erk1/2 and Akt was quantified by measuring intensities of densitometric immunoblot scans from three independent experiments. After normalization with loading controls, values of untreated cells were set to 100%. Data represent mean ± s.e.m. (b) Transactivation of TrkB by EGFR signaling was blocked by Src family kinase inhibitors PP1 (1 μM) and PP2 (100 nM) and the EGFR inhibitor PD153035 (100 nM). (c) Western blot analysis of cell cultures treated with a GFP control lentivirus, dnSRC, dnFYN lentivirus or a combination of dnSRC and dnFYN. Trk-PLCγ immunoreactive bands were significantly reduced in dnSRC- and dnFYN-treated cells. The lower panel shows quantitative analyses of densitometric immunoblot scans from three independent experiments (*P < 0.05, mean ± s.e.m., one sample t test). (d) dnSRC-DsRed was overexpressed as a fusion protein using a lentivirus. Positively infected cells, in comparison with uninfected cells in the same cultures, showed reduced pTrk-PLCγ immunoreactivity after EGF treatment. Similar observations were made with cells infected with a lentivirus encoding a dnFYN-GFP fusion protein. Arrowheads point to positively infected cells. Scale bars represents 10 μm. For full-length blots, see Supplementary Figure 10. n.t., not transfected; n. inf, not infected; n.s., not significant (P > 0.05).
Figure 4
Figure 4
Characterization of the 170-kDa band recognized by the pTrk-PLCγ antibody. (a) After immunoprecipitation of EGFR, no signal was detectable in the precipitate when probed with antibody to pTrk-PLCγ (third panel from the left), indicating no crossreactivity of antibody to pTrk-PLCγ with EGFR. Positive controls with antibodies to phospho-tyrosine and EGFR revealed that EGFR was present in the precipitate and activated following stimulation with EGF. (b) After immunoprecipitation with antibody to pTrk-SHC, both bands at 170 kDa and 130 kDa were detectable in the precipitate when probed with antibody to pTrk-PLCγ (third panel from the left). (c) Deglycosylation of EGF-treated cortical precursor cells with PNGase F shifted the 170-kDa Trk-immunoreactive band to about 145 kDa. Other deglycosylating enzymes that cleave processed glycosyl side chains typically found in cell surface proteins were not effective. The relative specificity of PNGase F indicated that Trk receptors are heavily N-glycosylated in early cortical neural precursor cells. (d) Immunostaining revealed that TrkB was localized intracellularly in untreated cortical precursor cells. After treatment with tunicamycin, which specifically inhibits the transfer of N-actelyglucosamine-1-phosphate in the first step of N-glycosylation, TrkB became detectable at the cell membrane. Scale bars represent 10 μm (left) and 3 μm (right). (e) Treatment of cortical precursor cells with tunicamycin for 12 h shifted the 170-kDa band for N-glycosylated Trk to 130 kDa. This treatment also restored BDNF responsiveness, indicating that tunicamycin reversed the retention of TrkB in an intracellular compartment.
Figure 5
Figure 5
Translocation of TrkB to the cell surface of cortical precursor cells in response to EGF. (a) TrkB immunoreactivity was localized predominantly in dot-like intracellular structures of cultured E12 neurosphere-derived cortical precursor cells and translocated to the membrane within 0.5 min of EGF treatment. Scale bars, 3 μm. (b) High-resolution STED microscopy identified TrkB in vesicle-like structures in untreated cultured E12 neural precursor cells. Following EGF challenge, signals for TrkB and pTrk-PLCγ showed a rapid translocation to a cell surface–like localization. Scale bars, 3 μm. (c) Avidin pulldown after biotinylation of cell surface proteins identified rapid cell surface translocation of TrkB after EGF treatment. The amount of cell surface TrkB that could be pulled down was reduced by simultaneous blockade of EGFR with 100 nM PD153035 (*P < 0.05, mean ± s.d. from three independent experiments, one-sample t test; n.s., not significant). (d) TrkB was mainly detectable in punctate vesicle-like structures in neural precursor cells of the ventricular zone and SVZ, whereas its localization changed to a more cell surface–like distribution in neurons in the cortical mantle zone. Scale bars, 50 μm (top panel) and 3 μm (lower panels). Full-length blots in Supplementary Figure 10.
Figure 6
Figure 6
Reduced transactivation of TrkB in Egfr−/− mice affects the formation of the cortical plate. (a) Reduced TrkB phosphorylation in Egfr−/− forebrain at E13. (b) Quantitative analysis of immunoblot signals for pTrk-PLCγ, pTrk-SHC and phospho-tyrosine in wild-type and Egfr−/− forebrain (*P < 0.005, n = 3, mean ± s.e.m., one sample t test). (c) At E16, the number of neurons in deeper layers of the cortical plate later forming layer V/VI was reduced, whereas the number of TrkB-positive cells in the marginal zone, cortical plate (CP) and SVZ was increased. Scale bars represent 150 μm (top), 100 μm (middle) and 50 μm (bottom). IZ, intermediate zone; VZ, ventricular zone. (d) The TrkB-positive cell population that is increased in the SVZ of E16 Egfr−/− forebrain coexpressed the neuronal marker MAP2. Scale bars represent 150 μm. (e) Stripe assays with EGF and BSA bound to different areas of a culture dish. Quantitative analysis of TrkB- and nestin-positive cells 20 h after plating revealed a significant increase of cells on EGF-coated stripes in comparison with BSA-coated stripes (*P < 0.001, mean ± s.e.m., one-way ANOVA; n.s., not significant). Scale bars, 100 μm. (f) Individual precursor cells at 6 h after seeding onto a BSA- and EGF-coated stripe substrate. pTrk-PLCγ staining accumulated at the migration front toward the EGF substrate. Scale bars, 10 μm. (g) Migration of cortical cells toward BDNF was enhanced in the presence of EGF. Scale bars, 50 μm. Data are presented as mean ± s.e.m. *P < 0.001. For full-length blots, see Supplementary Figure 10.

References

    1. Doetsch F, Caille I, Lim DA, Garcia-Verdugo JM, Alvarez-Buylla A. Subventricular zone astrocytes are neural stem cells in the adult mammalian brain. Cell. 1999;97:703–716. - PubMed
    1. Götz M, Huttner WB. The cell biology of neurogenesis. Nat Rev Mol Cell Biol. 2005;6:777–788. - PubMed
    1. Alvarez-Buylla A, Garcia-Verdugo JM, Tramontin AD. A unified hypothesis on the lineage of neural stem cells. Nat Rev Neurosci. 2001;2:287–293. - PubMed
    1. Gupta A, Tsai LH, Wynshaw-Boris A. Life is a journey: a genetic look at neocortical development. Nat Rev Genet. 2002;3:342–355. - PubMed
    1. Angevine JB, Sidman RL. Autoradiographic study of cell migration during histogenesis of cerebral cortex in the mouse. Nature. 1961;192:766–768. - PubMed

Publication types